Crypto analyst Valdrin Tahiri takes a look at the charts of the five top-selling altcoin projects last week, more specifically from May 28 to July 3. We have prepared Valdrin Tahiri’s analysis for our readers.
The first altcoin on the list Waves (WAVES)
WAVES has been falling ever since it hit an all-time high of $63.88 on March 31. The downside move dropped as low as $4.13 on May 29. Then, it started a sharp upward movement that still continues.
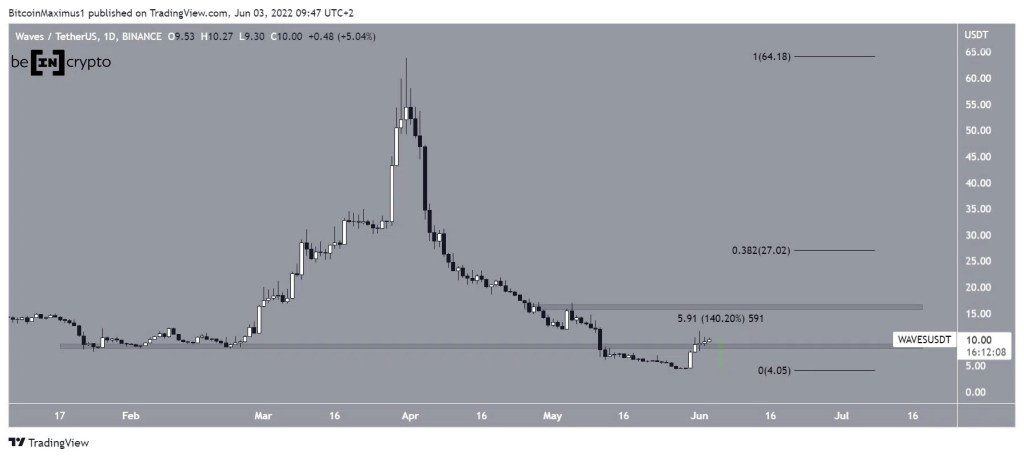
Since May 29 low, WAVES has gained 140% and reclaimed $9 horizontal space in the process. If the rise continues, the nearest horizontal resistance level is located at $16 and the nearest Fib resistance level is located at $27.
The next altcoin Cardano (ADA)
ADA has been rising within an ascending parallel channel since May 12. Such channels often contain corrective actions, which means that a breakdown from it is likely. You can learn about important developments for Cardano from this article of Kriptokoin.com.
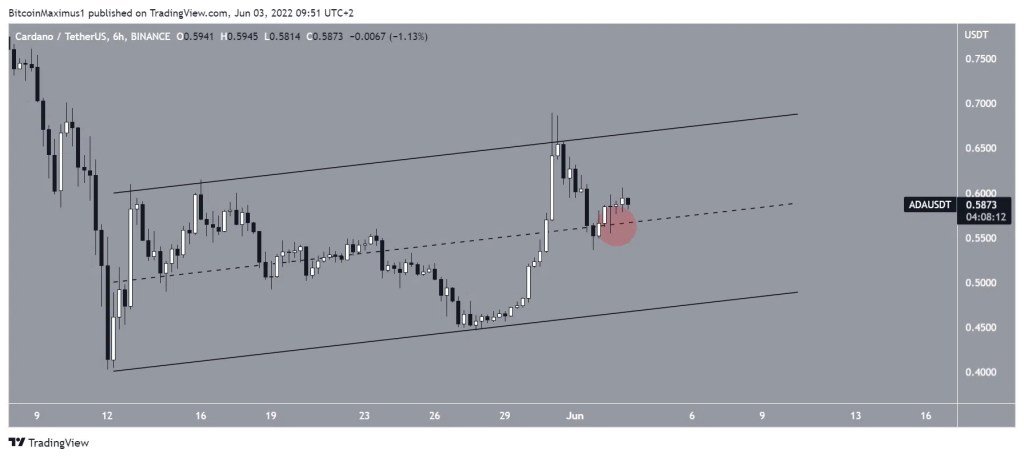
ADA price was rejected on May 31 by the resistance line of the channel (red icon) and has been falling ever since. It is currently holding above the middle of the channel (red circle). A drop below this level indicates a breakout and lower prices to come.
Third project Internet Computer (ICP)
Internet Computer has been down since it was rejected on June 2 (red icon). The downside move served to confirm the $9.40 area as resistance.
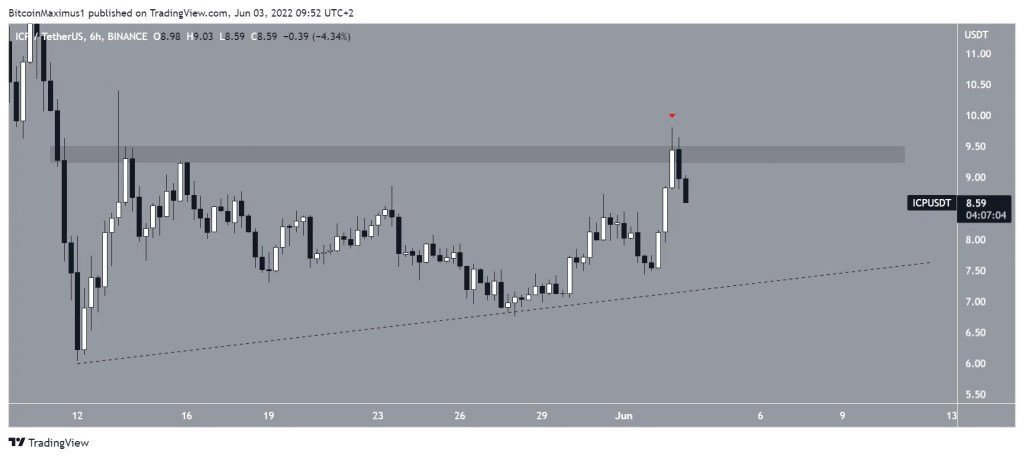
If ICP price continues to decline, the nearest support will be at $7.70 formed by an ascending support line.
The fourth altcoin on the list, Stellar (XLM)
XLM has been falling below a descending resistance line since April 4th. The downside move led to the low of $0.10 on May 12. XLM then bounced and went off the line on May 30.
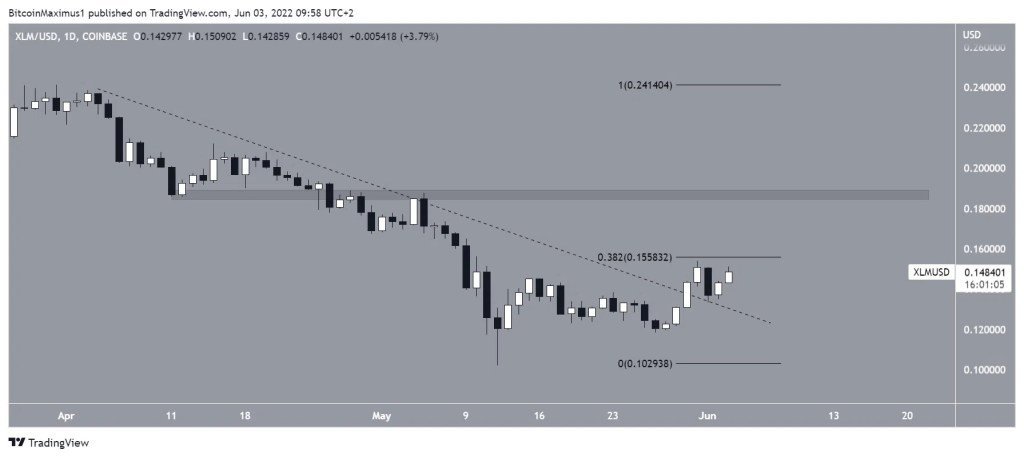
Stellar is currently struggling to exit the $0.155 resistance area. If the altcoin is successful in doing so, the next resistance will be at $0.187.
The latest altcoin project Helium (HNT)
HNT has been falling below a descending resistance line since Nov. The downside move dropped as low as $6.24 on May 12.
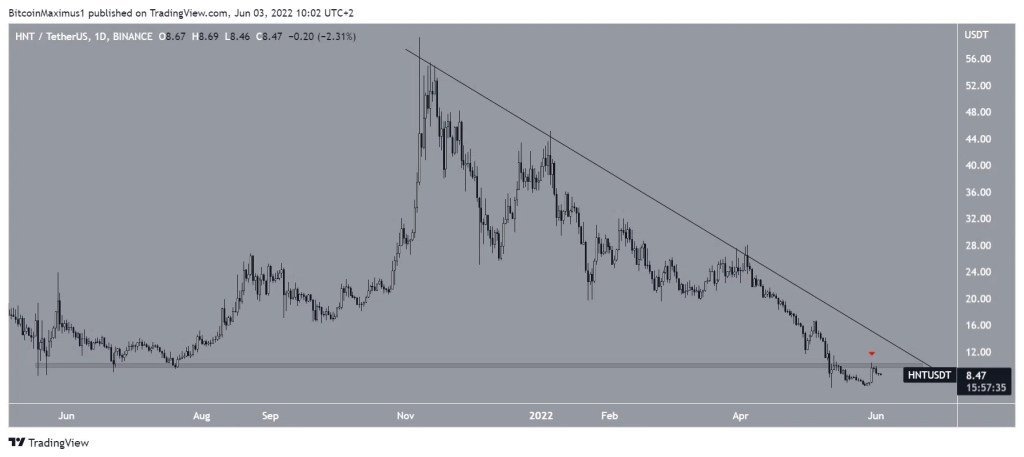
The price then jumped, apparently creating a double bottom model. However, it was rejected by the $10 resistance area on May 30 (red icon) and has been falling ever since. The $10 area also coincides with the descending resistance line mentioned above. Until HNT manages to retrace both, the trend cannot be considered bullish.