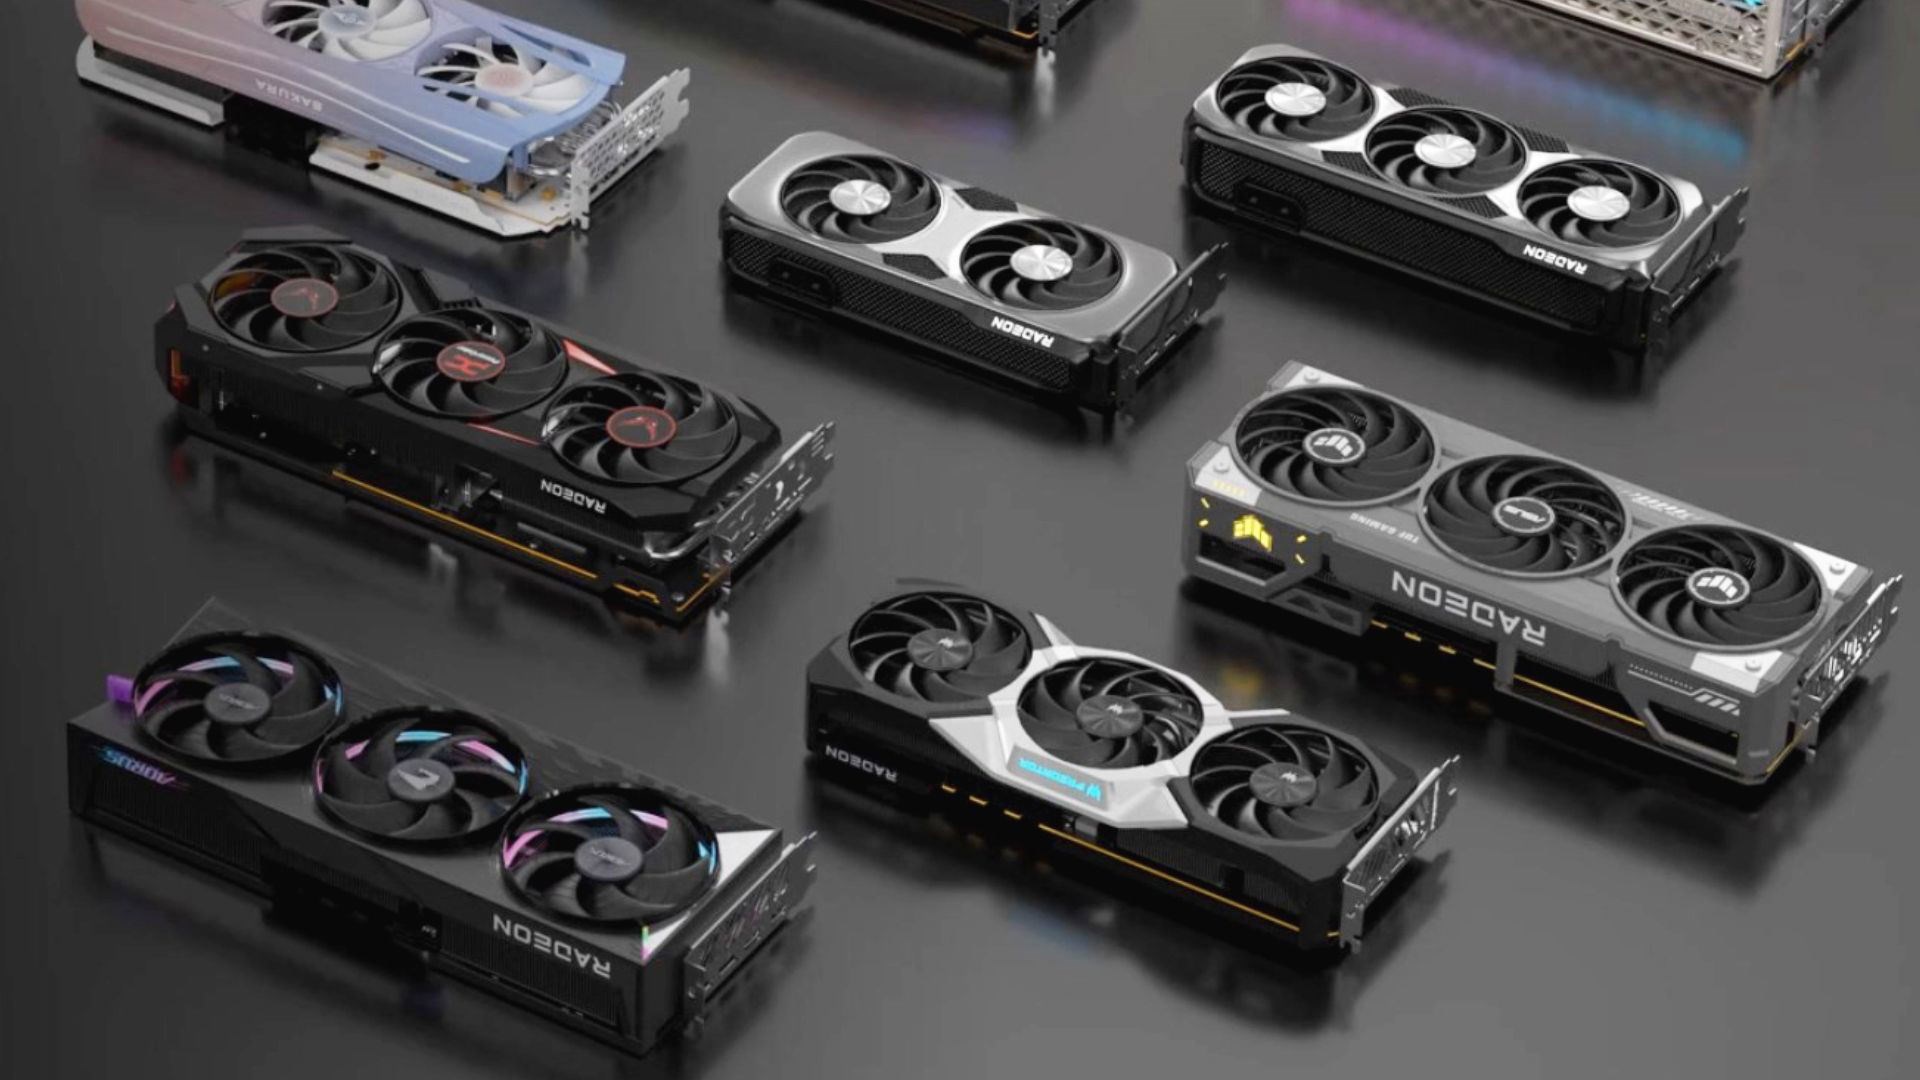
 The long -standing speculation about AMD’s new generation graphics cards has finally become clear. At a special press conference organized by the company, important details about the Radeon RX 9000 series and RDNA 4 architecture were shared. According to information published by VideoCardz, especially the Radeon RX 9070 XT will offer a significant performance increase compared to the previous generation.
Radeon RX 9070 XT has strong performance
According to leaked data, the Radeon RGX 9070 XT is 42 percent faster than the Radeon RX 7900 Gre model in 30 games from the tests performed in 4K resolution ultra graphics settings. The average difference is 38 percent at the resolution of 1440p.
In particular, the Cyberpunk 2077 and Hitman 3, which uses ray tracing technology extensively, is observed to increase performance increases by 164 to 168 percent. However, Dying Light 2, F1 24 and Hitman 3, such as 56 to 66 percent improvement is provided to improve. This shows that the RDNA 4 has taken a big step compared to its previous generations in radiation monitoring.
One of the most curious details among AMD’s new generation cards is the differences between RX 9070 XT and RX 9070 (non -XT version). According to data, the RX 9070 XT model offers higher performance between 16.1 (1440p) to 18.3 percent (2160p) compared to RX 9070. However, even the RX 9070 model performs better than 20 percent (1440p) to 21 percent (2160p) compared to RX 7900 Gre.
In the meantime, Nvidia’s new generation GeForce RTX 5070 Ti or any model is seen in these performance evaluations. AMD says that they do not have RTX 5070 Ti, but one will be provided for internal tests. But why is it an enigma that the RX 7900 XTX is not used. Previous reports suggested that the RX 9070 series could compete with the RTX 4070/4070 family and some RTX 50 series cards.
Official Promotion on February 28
AMD will share more information about the Radeon RX 9070 series on February 28, 2025 at the official launch. Although the accuracy of the leaked data until then is not certain, these new cards, which come with RDNA 4 architecture, will make a big leap, especially in the beam monitoring performance. In the meantime, FSR is not used in shared comparisons.
| Graphics card | RX 9070 VS 7900 GRE | RX 9070 XT VS RX 7900 GRE | ||
|---|---|---|---|---|
| Resolution and settings | 1440p ultra | 2160p ultra | 1440p ultra | 2160p ultra |
| F1 24 | 104 % | 105 % | 123 % | 123 % |
| Warhammer 40,000: Space Marines 2 | 109 % | 108 % | 123 % | 128 % |
| COD Black Ops 6 | 111 % | 111 % | 130 % | 133 % |
| Stalker 2 | 118 % | 118 % | 130 % | 133 % |
| Starfield | 118 % | 117 % | 132 % | 134 % |
| Assassin’s Creed Mirage | 121 % | 128 % | 132 % | 143 % |
| Cyberpunk 2077 | 115 % | 126 % | 132 % | 148 % |
| Final Fantasy XVI Demo | 118 % | 122 % | 133 % | 140 % |
| Dragon Age veilguard | 126 % | 125 % | 138 % | 141 % |
| God of War Ragnarök | 123 % | 124 % | 143 % | 146 % |
| Black Myth Wukong | 122 % | 120 % | 144 % | 142 % |
| Avatar Frontiers of Pandora (RT) | 112 % | 111 % | 134 % | 136 % |
| Far Cry 6 (RT) | 126 % | 125 % | 137 % | 146 % |
| The Witcher 3 (RT) | 115 % | 122 % | 139 % | 148 % |
| Star Wars Outlaws (RT) | 122 % | 123 % | 144 % | 148 % |
| Watch Dogs Legion (RT) | 125 % | 130 % | 145 % | 152 % |
| Hitman 3 (RT) | 128 % | 128 % | 157 % | 159 % |
| Dying Light 2 (RT) | 132 % | 130 % | 159 % | 156 % |
| Cyberpunk 2077 (RT) | 133 % | 133 % | 164 % | 16 % |
| F1 24 (RT) | 138 % | 134 % | 168 % | 166 % |
| Average difference | 20 % | 21 % | 38 % | 42 % |