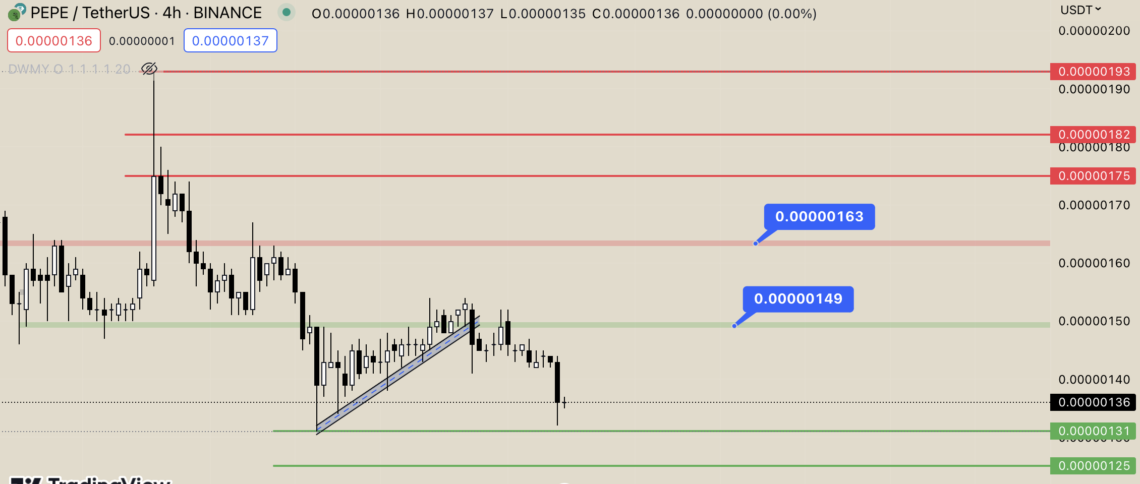
The breakout of the ascending channel structure we mentioned for Pepe (PEPE) led to a close to 15 percent drop in memecoin.
In a news we prepared on May 27, we stated that a dangerous structure has formed for Pepe (PEPE). This emerging channel structure was broken downwards, triggering the sales on the PEPE side. PEPE, which lost value by 14.10 percent within hours, surprised memcoin lovers. In PEPE, one of the new countable coins for the market, the chart is maturing. So, can this decline continue? What does the PEPE chart show?
Pepe (PEPE) Graphic Analysis
PEPE, which has formed an “ascending channel structure” in the past days, broke this channel downwards and realized a decrease of 10 percent. After touching $0.00000150, memecoin, which saw intense selling pressure, pinned up to $ 0.133. At the same time, there is no trace of PEPE, which has reached the lowest levels in terms of volume. Despite returning from a critical threshold on the 4-hour chart, the danger signals for PEPE are not over yet.
On the long-term chart, the resistance levels for PEPE are 0.0000015 – 0.00000163 – 0.00000175 – 0.00000182 and 0.00000193 dollars respectively. Support points where buyers can react could be $0.00000131 and $0.00000125.
