In the third week of February, the BTC price took a big hit. Ethereum, Ripple and other cryptocurrencies have also seen losses at the same rate as a result of this decline.
BTC price on the verge of reversal
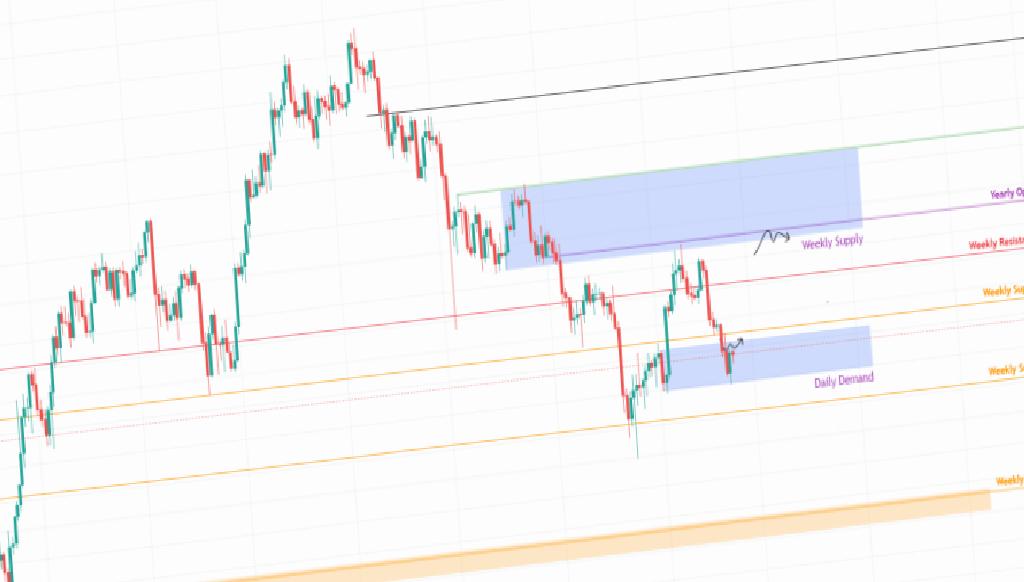
Bitcoin is currently trading in the demand zone of $36,398 to $38,895. If BTC bulls can find the necessary strength, the bulls will test for the $42,748 resistance, which would mean a 12% increase. According to analyst Akash Girimath, in this scenario, the price of Bitcoin could rise above this level and reach the lower limit of the weekly supply zone at $45,550.

Additionally, if bitcoin price produces a daily candlestick near $36.3698, it will create a lower low (LL) and invalidate the bullish thesis.
Ethereum price still limited in its upward movement
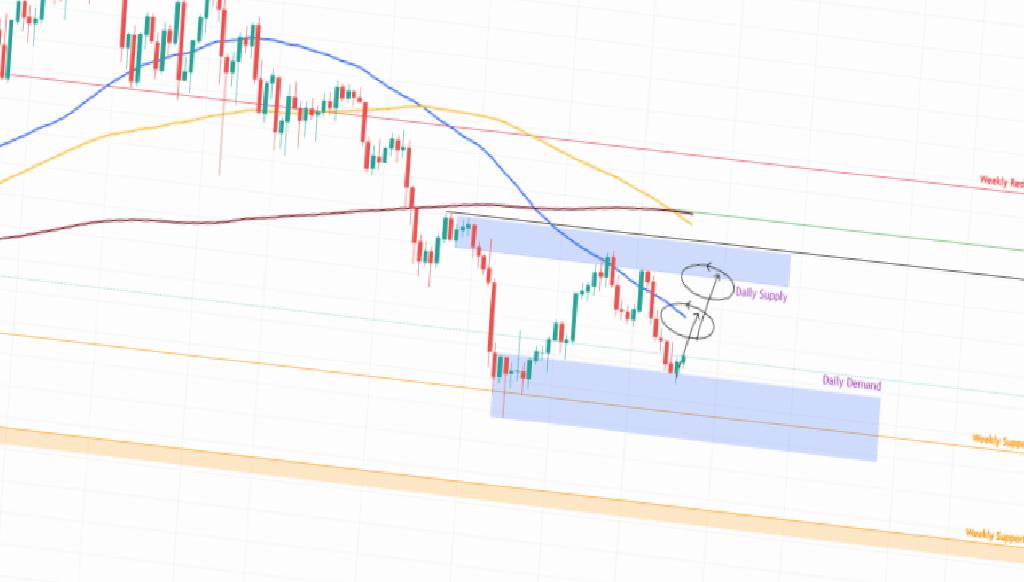
The price of Ethereum is currently ranging from the daily demand zone between $2,160 to $2,567. The 50-day SMA, around $2,925, is ETH’s initial resistance. Once past this level, traders will target the daily supply zone, which ranges from $3,188 to $3,393. If this strong resistance is overcome, ETH price could reach $3,600, the intersection of the 200-day and 100-day SMAs. According to the analyst, Ethereum’s upside potential is limited at this level.

Similar to Bitcoin’s case, if Ethereum price closes a daily candle near $2,160, it will end its bullish thesis. This could push ETH lower and the decline could deepen to the $1,730 support base.
Ripple (XRP) technical analysis
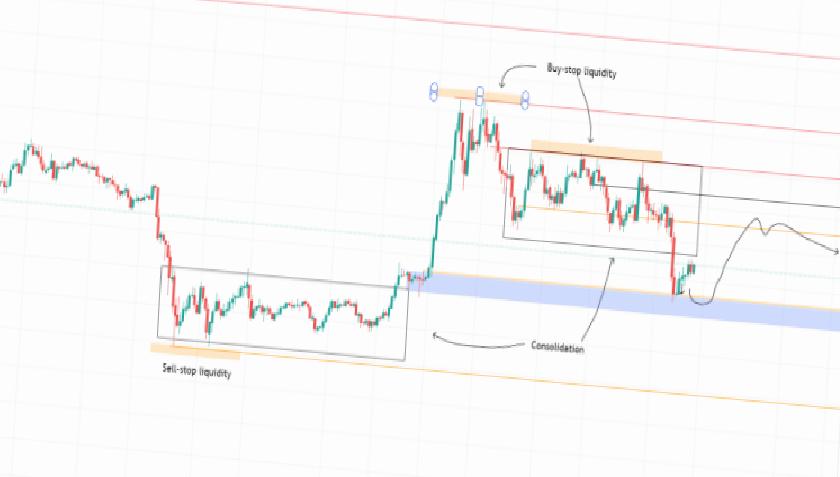
Between February 21 and 22, Ripple (XRP) fell 16% to reach the demand zone of $0.650 to $0.677. However, after entering the aforementioned support level, buyers are taking action as the XRP price is up 8%. This uptrend can be expected to continue until it retests the $0.778 resistance level. In a possible increase in buying demand, Girimath notes that the bulls are targeting the local top of $0.813.

Shiba Inu price trapped in BTC drop
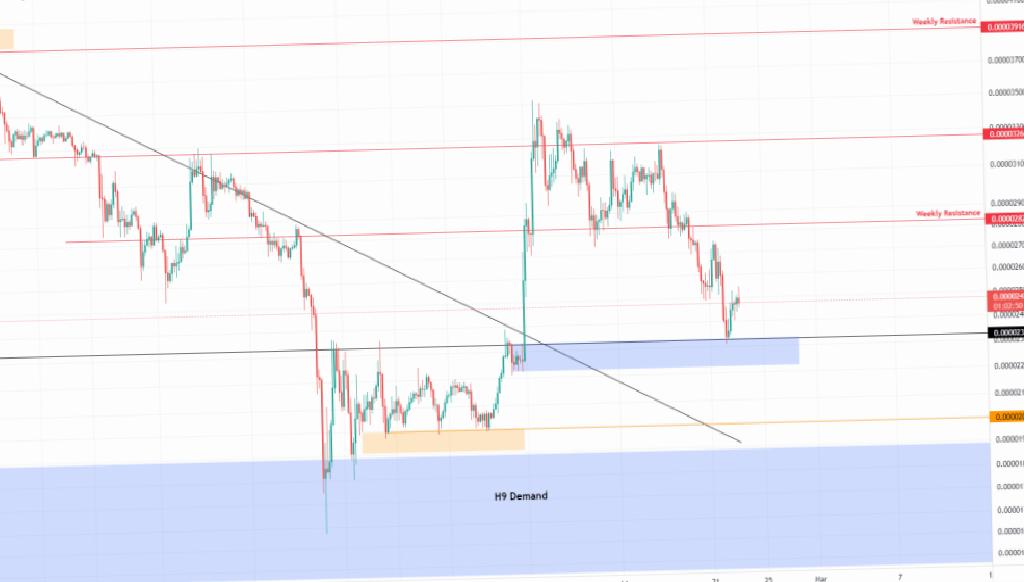
As we have covered in the cryptokoin.com analysis, the price of Shiba Inu (SHIB) breached the $0.0000283 support level. lost 28% in four days after This drop is now bouncing off the $0.0000233 resistance level, which corresponds to the demand zone between $0.0000224 and $0.0000233. SHIB is expected to bounce off this hurdle and trigger a quick rally to the newly returned weekly resistance level at $0.0000283. As a result, in the foreseeable future, investors can expect the meme token to consolidate between these two resistances.

The reason the Shiba Inu price is slightly positive is due to the Bitcoin price. A sharp increase in selling pressure could tip the odds in favor of the bears. If it closes below $0.0000224 on the four-hour chart, SHIB will make a lower low (LL) which will invalidate the bullish argument. In this case, the Shiba Inu price could decline to the $0.0000202 support level, where the bulls can heal up before the next uptrend.