Altcoins including Bitcoin and SHIB came alive today. But is this rally nothing more than an oversold bounce? What are the important support and resistance levels that must be crossed to start the trend movement in Bitcoin and altcoins? Crypto analyst Rakesh Upadhyay examines the charts of the top 10 cryptocurrencies to find out.
An overview of the cryptocurrency market
When the markets are trending, traders need to be active if they want to make money. On the other hand, in a volatile market, it is better to wait patiently on the sidelines. Otherwise, traders may lose money due to fluctuating random movements in both directions. The sideways price action since Bitcoin’s sharp fall on August 17 shows that the bulls and bears are unsure of the next directional move. Therefore, it is better to wait for the breakout to occur before placing big bets.
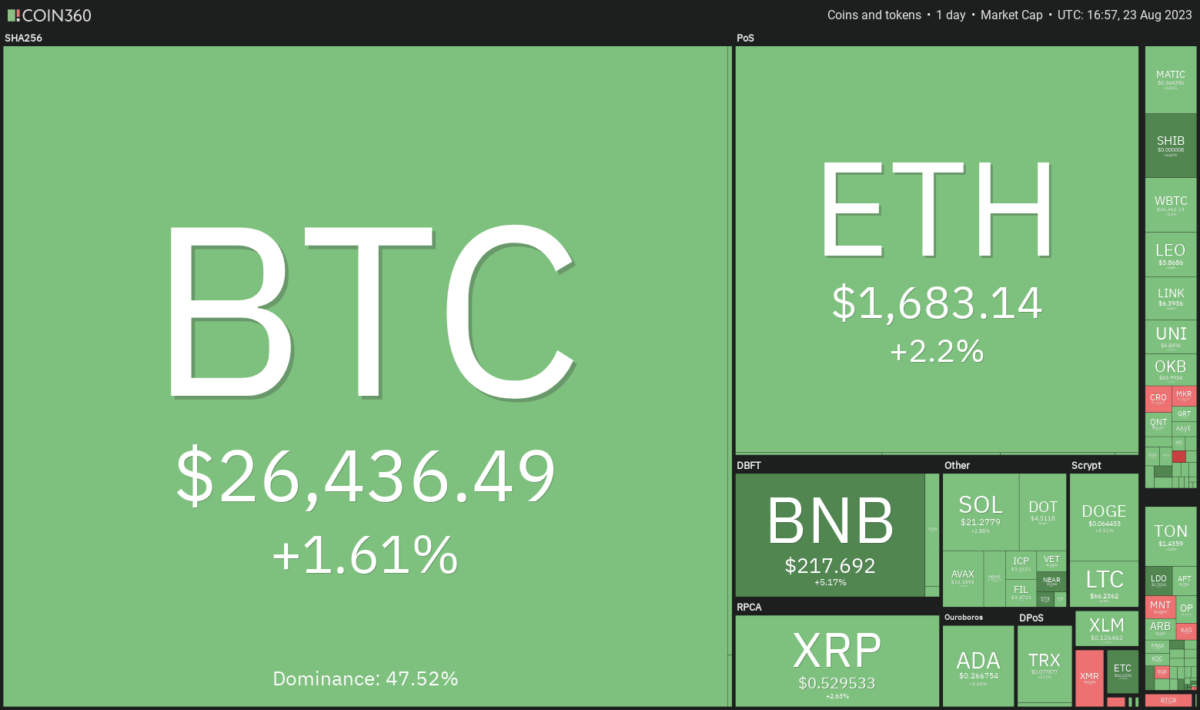 Daily cryptocurrency market performance. Source: Coin360
In the short term, institutional investors are also taking a cautious approach. As you follow on Kriptokoin.com, a CoinShares report showed an outflow of $55 million from digital asset investment products during the week of September 13.
BTC, ETH, BNB, XRP and ADA analysis
Bitcoin (BTC) price analysis
The long tail on Bitcoin’s August 22 candlestick shows that the bulls are fiercely trying to protect the support at $24,800. So it’s a positive sign. However, the bulls will remain under pressure until they break through the extreme hurdle of $26,833 and then the 20-day exponential moving average (EMA) of $27,777.
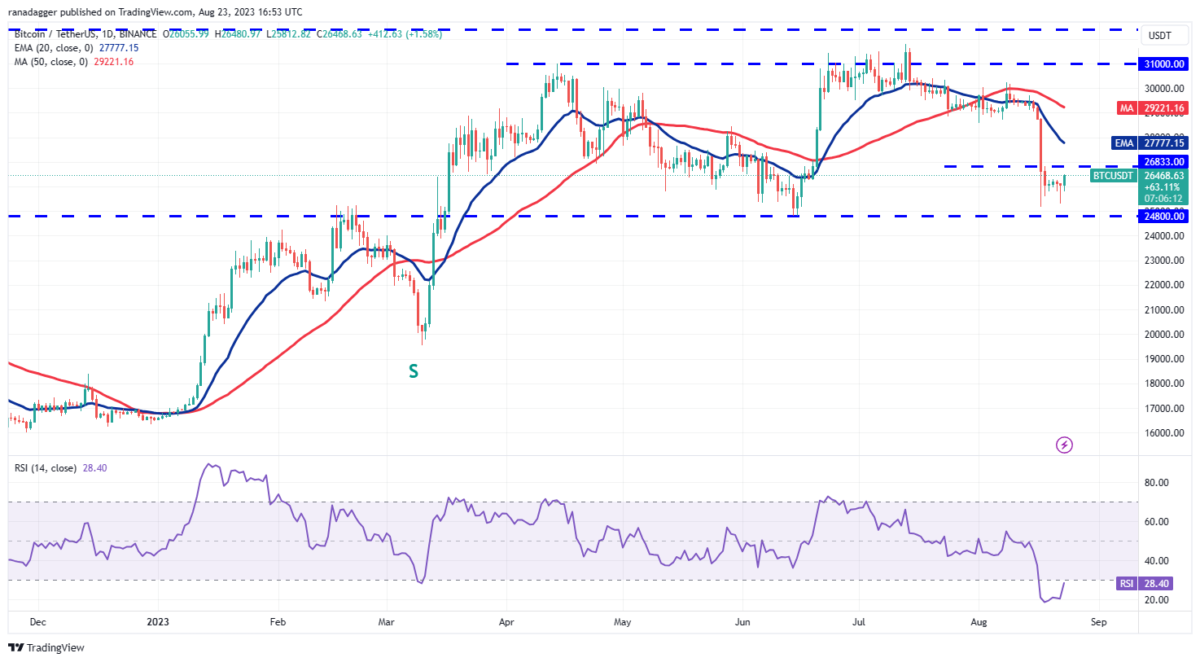
If it surpasses both of these resistances, it will likely indicate that BTC will extend its stay in the $24,800 to $31,000 range for a while. The falling 20-day EMA points to an advantage for the bears. However, oversold levels in the relative strength index (RSI) point to a possible recovery in the near term. The bears will need to push and sustain the price below $24,800 to further strengthen their hold. This is likely to open the doors for a potential drop to $20,000.
Ethereum (ETH) price analysis
Ether once again slumped below the strong support at $1,626. However, the long tail on the candlestick indicates solid buying at the lower levels. It is up to the bulls to push the price above the overhead resistance of $1,700. If they do, it is possible for ETH to reach the 20-day EMA ($1,756).
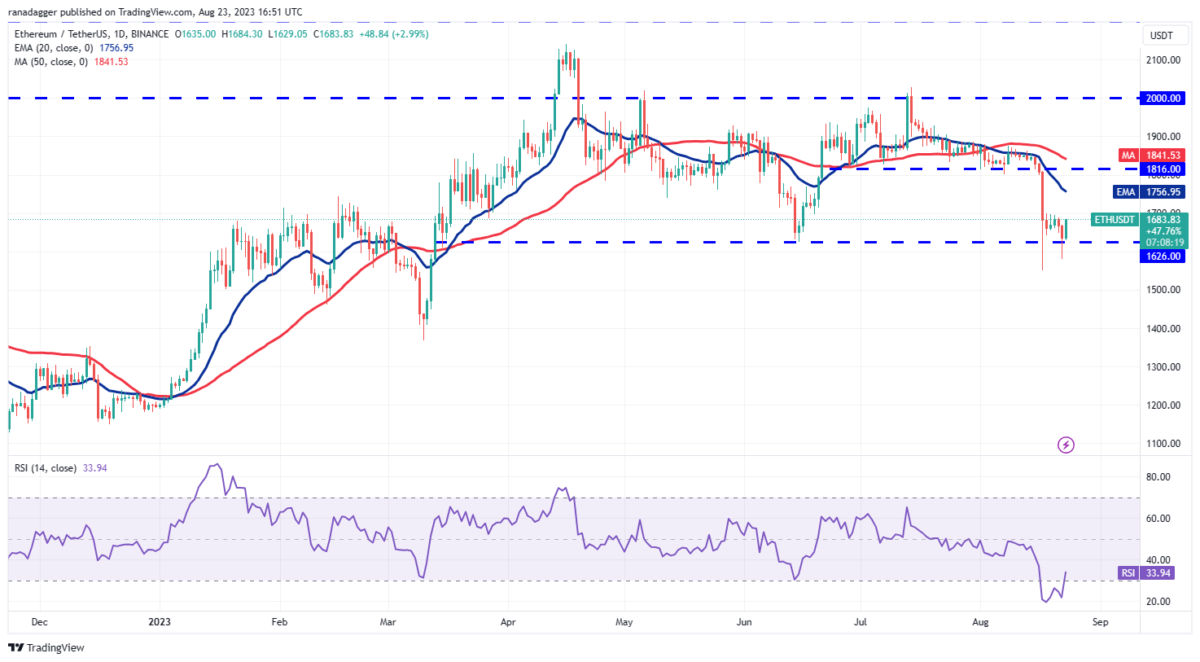
This remains the key level to watch out for in the near term. If the price turns down from this level, the bears will again try to push ETH below the $1,626 to $1,550 support zone. If they are successful, ETH is likely to start a downside move towards $1,368. On the contrary, a break above the 20-day EMA will increase the likelihood of ETH staying in the $2,000 to $1,626 range for a few more days.
Binance Coin (BNB) price analysis
BNB bounced off the psychological support at $200 on August 17. Thus, it showed that the bulls are trying to stop the decline from this level.
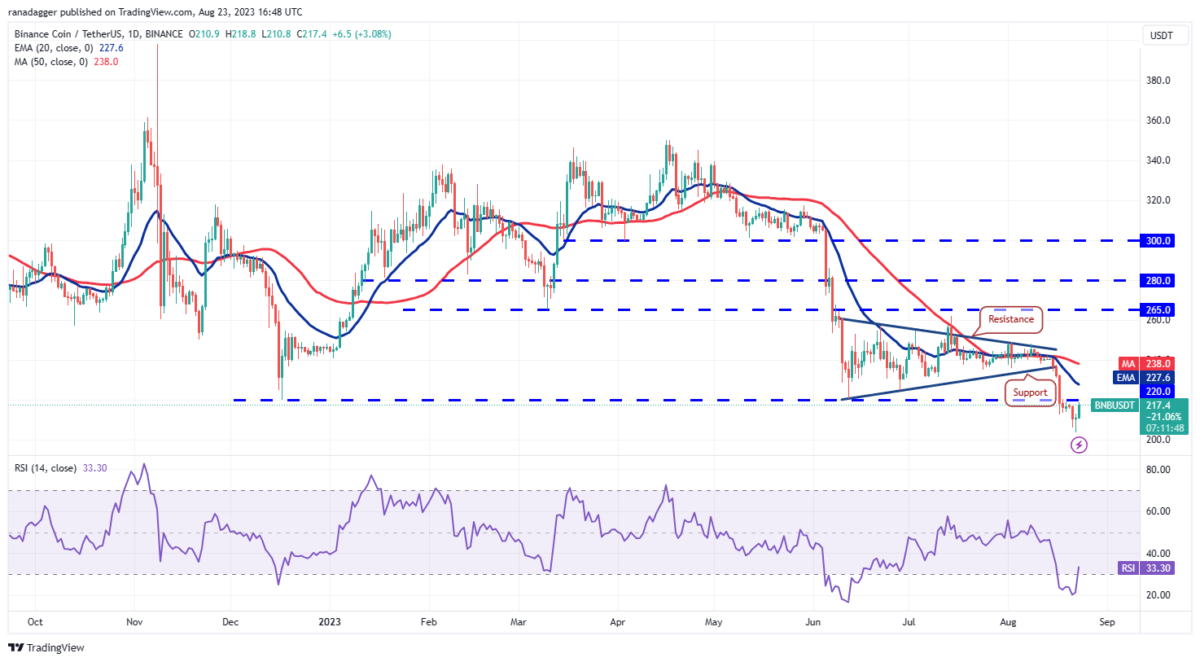
A recovery is possible to reach the 20-day EMA ($227). However, this will again pose a formidable hurdle. If BNB declines sharply from the 20-day EMA, the bears will make another attempt to sink the BNB pair below $200. If they do, BNB is likely to drop as low as $183. Instead, if the price rises above the 20-day EMA, it will indicate that the bears have lost control. BNB could then rise to the resistance line, which is an important level for the bears to defend.
Ripple (XRP) price analysis
XRP declined from the overhead resistance level of $0.56. However, the fact that the bulls did not allow the price to drop below $0.50 is a minor positive development. It is possible for XRP to consolidate between $0.50 and $0.56 for a while.
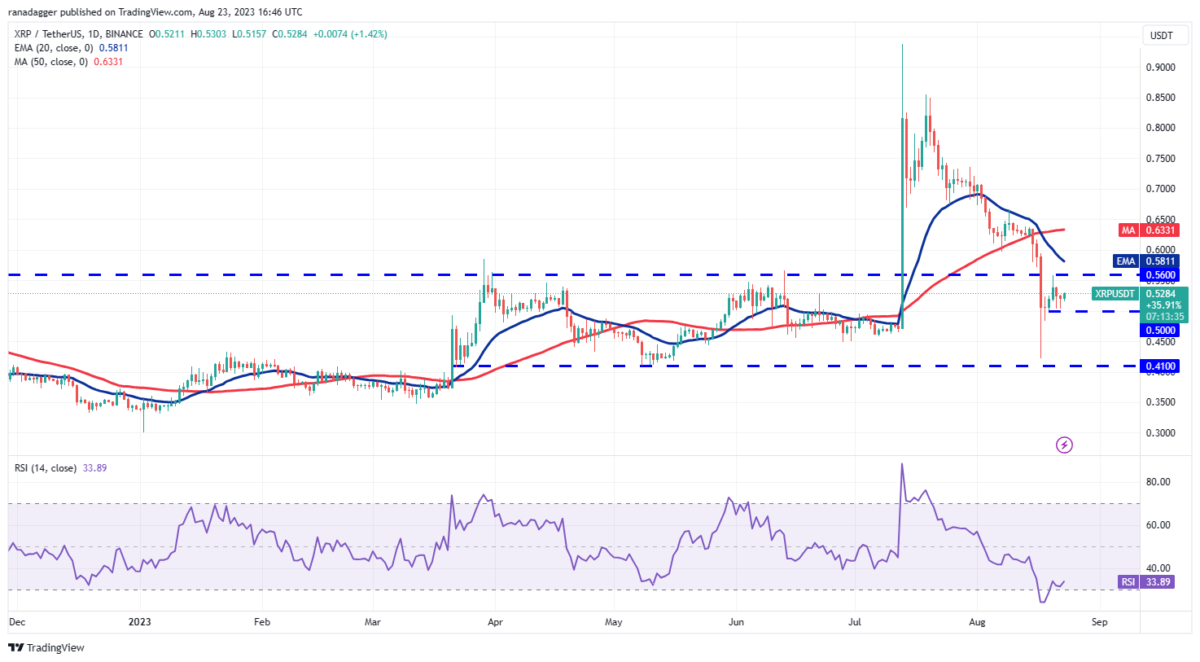
The falling 20-day EMA ($0.58) and the RSI near the oversold zone point to an advantage for the bears. If the price drops below $0.50, XRP is likely to start its descent towards the next major support at $0.41. This indicates a range-bound movement between $0.41 and $0.50. Alternatively, if buyers push the price above the 20-day EMA, it will indicate that the bulls are in a reversal. XRP is likely to rise later to $0.63, the 50-day simple moving average (SMA).
Cardano (ADA) price analysis
The long tail on the Cardano August 22 candlestick indicates strong demand at the lows. The price is currently stuck in the range between $0.24 and $0.28.
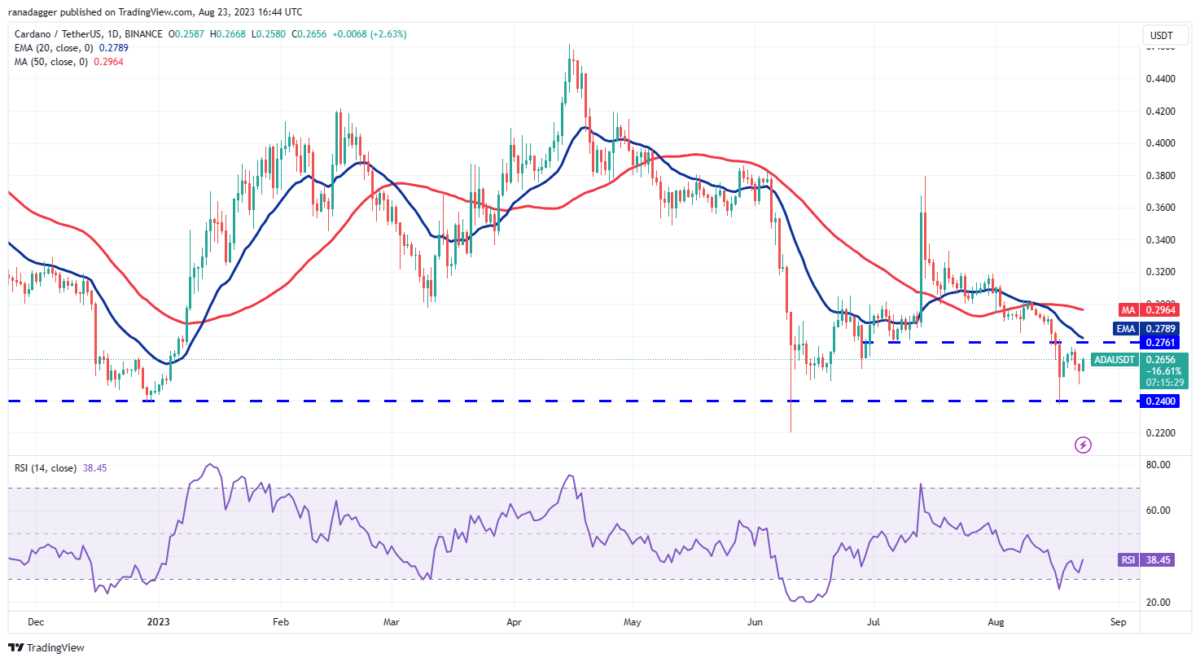
If the price breaks below $0.24, ADA is likely to start the next leg of the downtrend. Thus, it is possible for ADA to drop to $0.22 and then to the psychological support of $0.20. The falling 20-day EMA ($0.28) and the RSI in the negative territory suggest that the bears have a slight advantage. This negative view will be invalidated in the near term if buyers push the price above $0.28. If they do, ADA is likely to start a relief rally to the 50-day SMA ($0.29) and then to $0.32.
SOL, DOGE, DOT, MATIC and SHIB analysis
Solana (SOL) price analysis
Solana broke below the close support at $20 on August 22. However, the bulls bought the dip. Thus, they showed lower levels of demand.
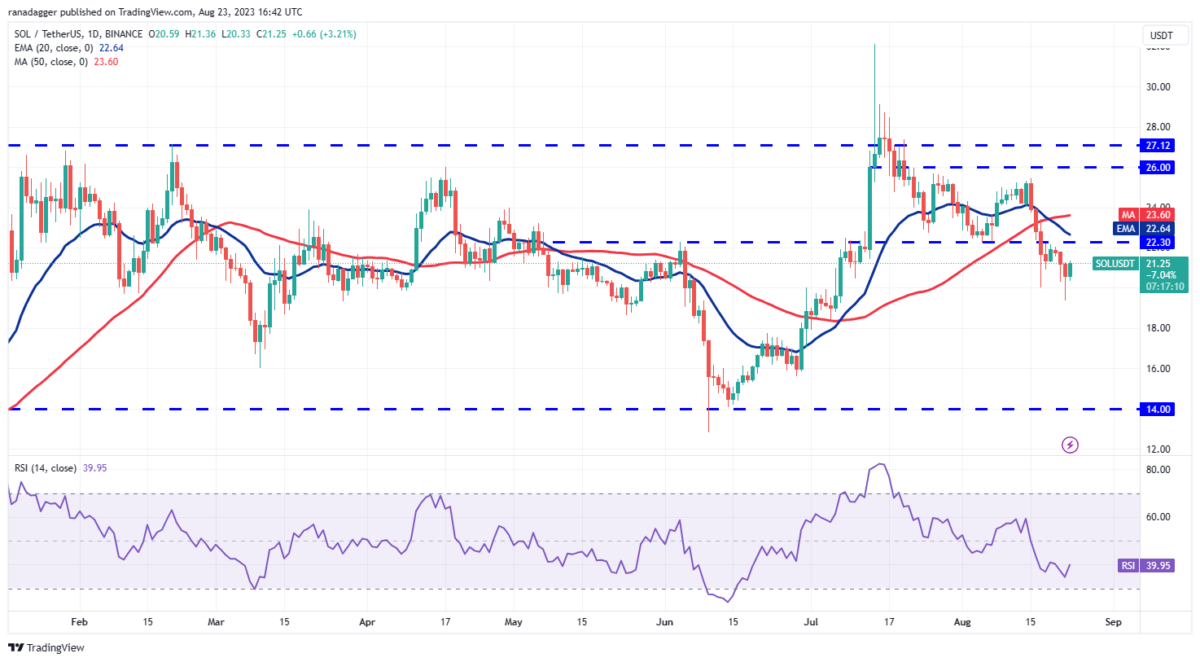
If buyers want to recover, they will have to push the price above the 20-day EMA ($22.64). Above this level, SOL is likely to gain momentum and attempt to climb higher to $26. The 50-day SMA ($23.60) is likely to act as a barrier. However, it will likely be overcome. Contrary to this assumption, if the price turns below the current level or the 20-day EMA, it will indicate that the bears are not giving up. This will increase the probability of a drop below $19.35. If this happens, SOL is likely to drop to $18 and eventually to $16.
Dogecoin (DOGE) price analysis
Dogecoin recovered from the $0.06 support on August 21 and 22. Thus, it showed that the bulls were buying the dips up to this level.
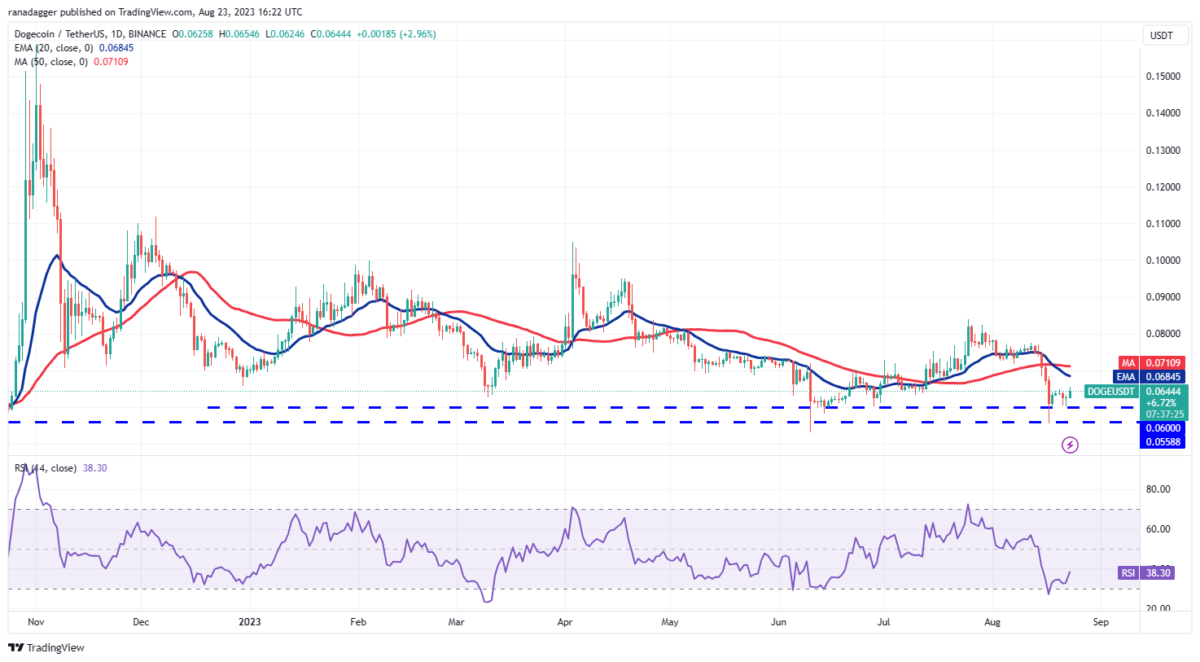
The bulls are attempting to start a relief rally that could reach the 20-day EMA ($0.07). Sellers are likely to fiercely maintain this level. If the price turns down from overhead resistance, it will indicate that DOGE will be stuck between the 20-day EMA and $0.06 for a while. Buyers will need to push the price above the moving averages to start a rally towards the next major resistance above $0.08. On the downside, a break and close below $0.06 could mark the start of a downside move to $0.05.
Polkadot (DOT) price analysis
The bears tried to push Polkadot below the vital support at $4.22. However, the bulls held their ground, as seen by the long tail on the August 22 candlestick.
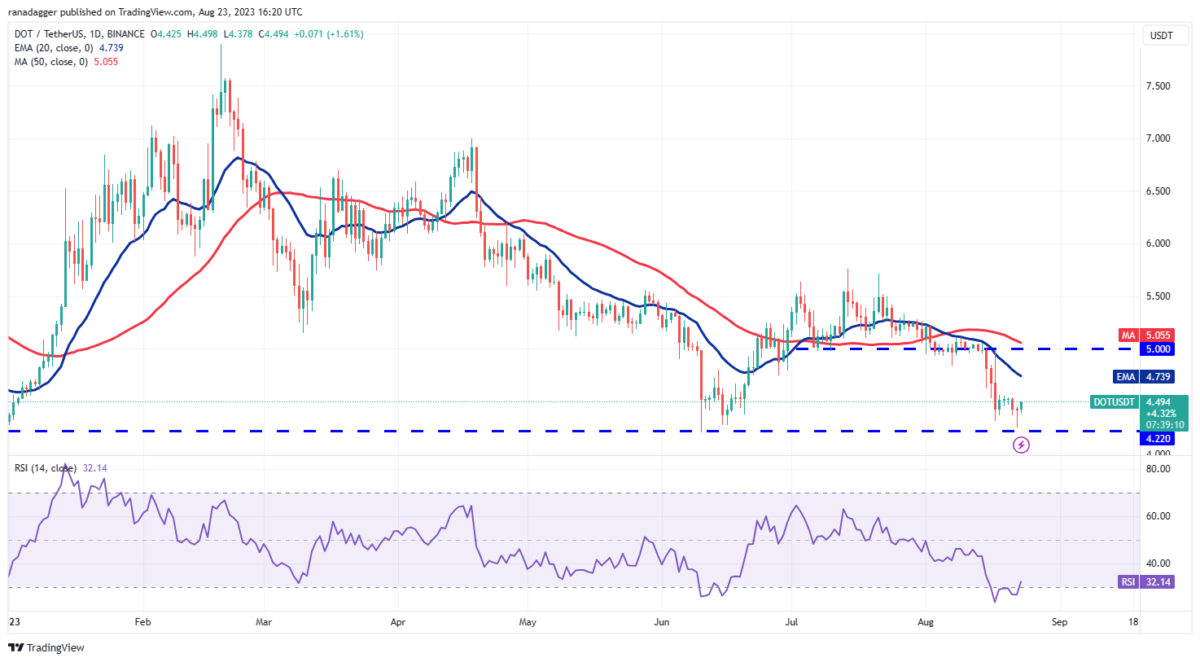
The 20-day EMA ($4.73) is turning down and the RSI is in negative territory. This shows that the bears have the upper hand. If buyers want to signal a reversal, they will need to push the price above the overhead zone between $4.56 and the 20-day EMA. In the meantime, the bears are likely to have other plans. They will try to sell on minor rallies and push the price below $4.22. If they are successful, the DOT is likely to start the next leg of the downtrend. The next support is at the $4 level.
Polygon (MATIC) price analysis
Polygon is back on August 22 at $0.53. This indicates that the bulls are trying to keep the price above the key $0.51 support.
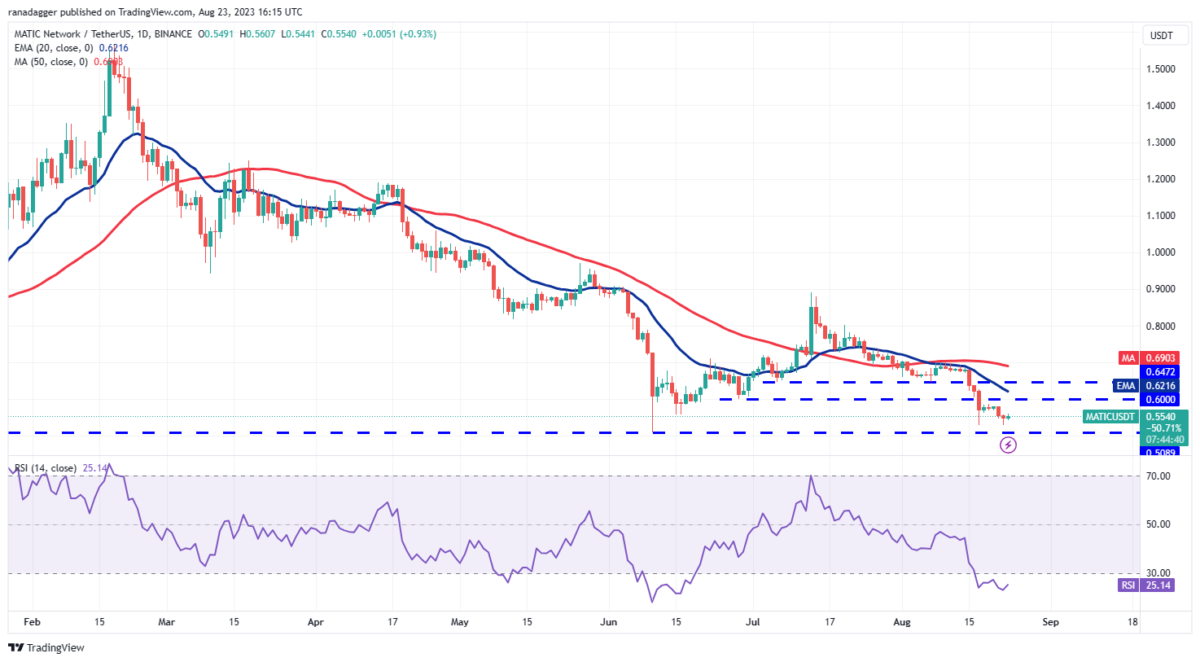
The bulls have to fulfill their duties as they can face a strong sell at $0.60. If the price turns down from this resistance, it will indicate that the bears are active at higher levels. This situation is likely to keep MATIC in the $0.51 to $0.60 range for a few days. A breakout and close below $0.50 will signal the resumption of the downtrend. MATIC is likely to drop to $0.45 later and then to $0.42. Conversely, a rally above $0.60 is likely to create a rally to $0.65 and then to $0.69.
Shiba Inu (SHIB) price analysis
SHIB broke below the 50-day SMA ($0.0000084) on August 20. However, the bulls did not allow SHIB price to retest the crucial support at $0.0000072.
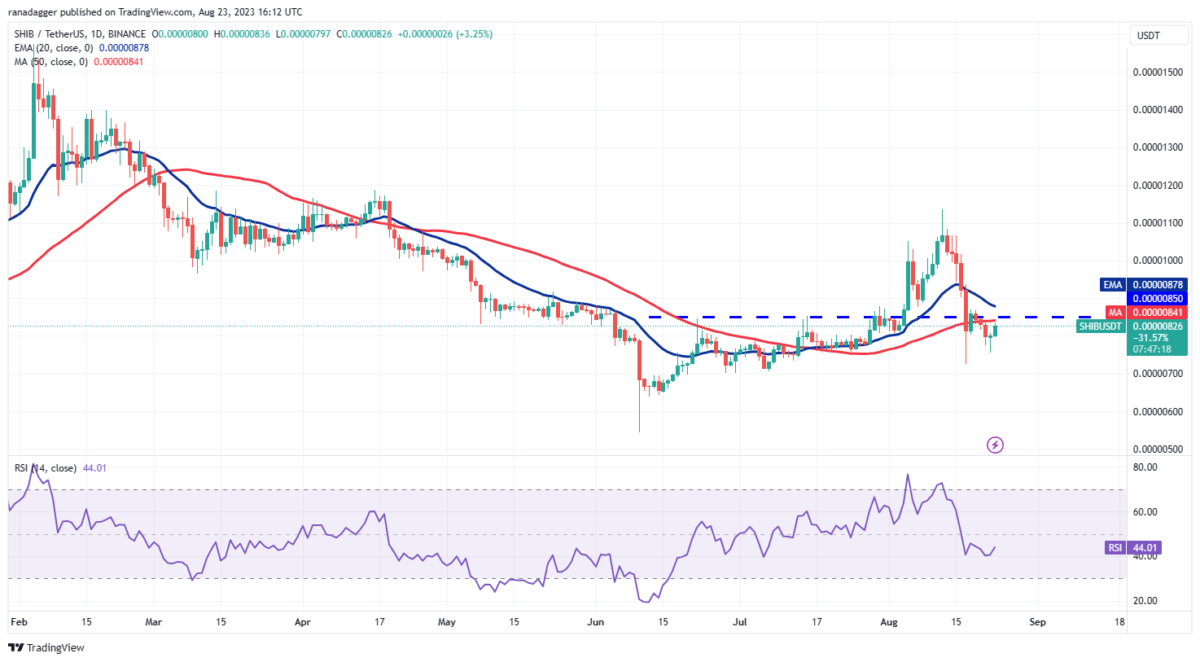
Solid bounce on August 22 shows strong buying for SHIB at lower levels. The bulls will then attempt a rally above the moving averages. If they do, it is possible for the SHIB price to gain momentum. Thus, SHIB price is likely to rise towards $0.000011. Conversely, if the price turns down from the moving averages, it will indicate that the bears are in control. SHIB price is likely to decline towards the strong support at $0.0000072 and then towards $0.0000064.