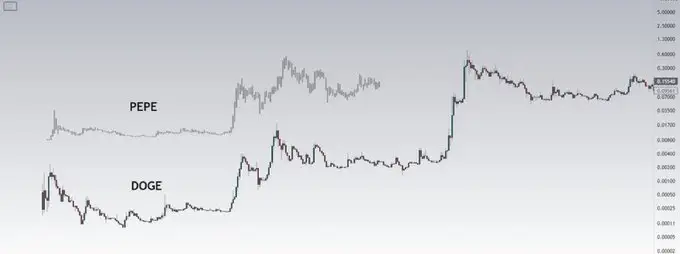
The cryptocurrency analyst pointed out new peaks, noting that there are similarities between the Pepe price and DOGE’s rally in 2021.
As positive expectations for the fourth quarter slowly recover in the crypto market, Bitcoin price is approaching a new all-time high. Within this upward momentum, the meme cryptocurrency sector, known for its volatility, also shows the potential to lead a high-momentum rally. The cryptocurrency analyst emphasizes that the Pepe Coin price mimics the chart formation before DOGE’s rally in 2021.

Dogecoin (DOGE) rally signals for PEPE
In a recent post, crypto analyst Waleed.Eth shared interesting similarities between Pepe and Dogecoin prices ahead of 2021. According to daily chart analysis, DOGE price followed a sideways trend for years before making a big move up. Afterwards, there was an increase of 29,100 percent.
Over the last 5 months, Pepe price has shown a similar consolidation, falling by 49.7 percent from its ATH of $0.000017. However, the crypto market is signaling a new bull run following Bitcoin’s rise to new highs and the US presidential elections in 2024. If this theory proves true, a DOGE-style rally in 2020 could push the Pepe price as high as $0.0025.
Investor confidence is increasing
According to Coinglass data, there has been a significant recovery in Pepe’s open interest volume. The OI value increased from $60.5 million in early August to $170.8 million, representing a growth of approximately 182.3 percent.
This significant increase indicates that investor confidence is increasing and market activity around memecoin is intensifying. This development indicates an upward trend and increased speculative interest in Pepe’s future performance.
Levels to consider for PEPE
At the time of publishing the news, Pepe price was trading at $0.0000086, with a daily loss of 2.47 percent. According to CoinGecko data, PEPE’s market value is around 3.64 billion dollars and its 24-hour trading volume is around 781.2 million dollars. With selling pressure, PEPE price may decrease by 3.67 percent and fall to the support trend line of the symmetrical triangle model.
This chart pattern channels the above-mentioned consolidation trend within two converging trend lines. A possible breakout from the uptrend line may indicate a continuation of the uptrend. However, if the upper trend line is not broken, Pepe could start the big rise.