
According to analysts, Cardano (ADA)’s bearish trend may soon wear off, causing prices to rise again. The Tom DeMark (TD) Sequential indicator adds confidence to the optimistic outlook as it currently offers a buy signal on ADA’s three-day chart. As Kriptokoin.com, we have previously reported in this article, over 25 cryptocurrencies and Bitcoin signals of the indicator in question have been correct in recent years.
Cardano looks ready to recover
Cardano appears to be sitting in oversold conditions, possibly leading to a bullish impulse. While the support looks weak, several technical indicators support the optimistic view. ADA seems to have reached an important support area while stuck in a six-month bear trend.
ADA has lost significant ground since hitting an all-time high of $3.10 in September 2021. While other Tier-1 tokens such as Terra’s LUNA have recently regained momentum, Cardano continues its bear trend as it remains 75% below its peak. The downward pressure seen in the last few months has brought the asset to a breaking point.
Analysts state that Cardano’s price action is located within a descending parallel channel developing on its three-day chart from September 2021. Since then, every time ADA has risen to the upper boundary of this technical formation, the bullish trend has exhausted, causing the price to retrace to the middle or lower edge of the pattern. From this point on, ADA tends to rebound, which is consistent with the characteristics of a parallel channel.
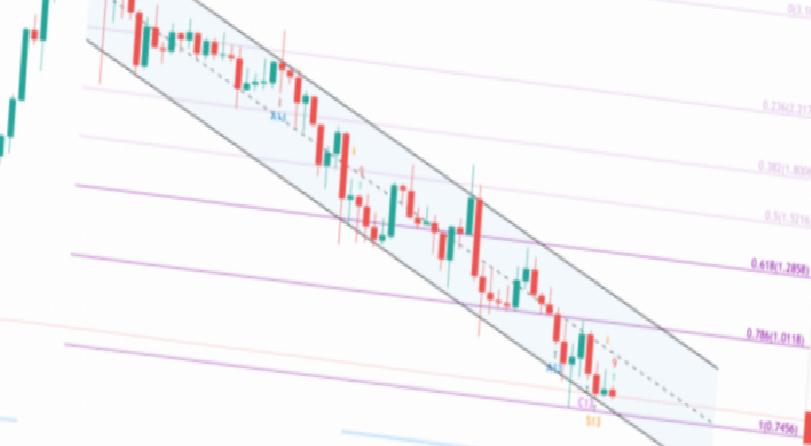
After being rejected from the middle trendline of the channel in late February, Cardano says the pattern has returned to its currently trading lower border. According to analysts, if this support level can continue as it has in the last six months, ADA could bounce back to the middle or upper edge of the channel. These resistance levels are at the $0.87 and $1 levels.
The Tom DeMark (TD) Sequential indicator adds confidence to the optimistic outlook as it currently offers a buy signal on ADA’s three-day chart. The bullish pattern developed as a red nine candlestick, which is a bullish one to four candlestick pattern.
Although the odds are in favor of the bulls, the $0.75 support level is crucial. Analysts note that any sign of weakness at this price point could cause further panic among market participants, which could lead to a sell-off. An increase in selling pressure around such a vital support area could push ADA towards $0.50.


