As we reported on cryptokoin.com, Bitcoin (BTC) tumbled over the weekend as investors were wary of US consumer inflation data to be released on July 13. Due to macro uncertainty, investors are unsure if the Bitcoin correction is over. However, Jurrien Timmer, global macro director at Fidelity Investments, said that Bitcoin is back to 2013 bull market levels given its “non-zero price per address.” This means “Bitcoin is cheap”. Are altcoin projects showing signs of bottoming out? Here are 4 altcoins and predictions to watch this week…
First altcoin on the list: Uniswap (UNI)
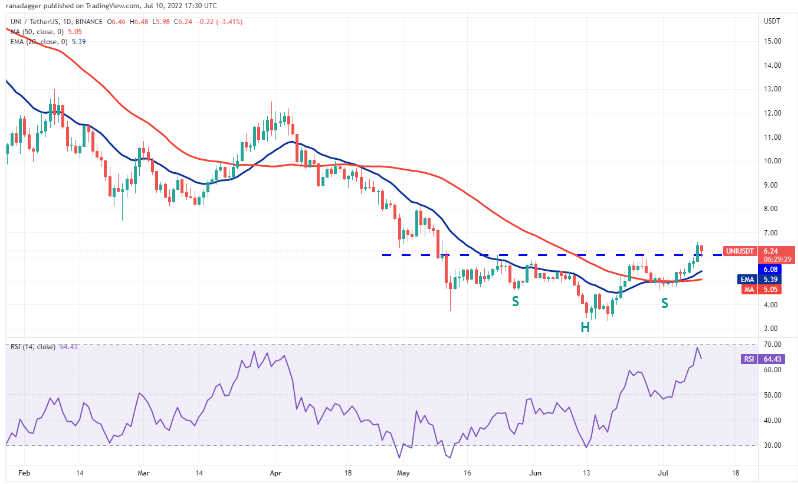
Uniswap (UNI) broke above the overhead resistance at $6.08, completing the bullish reverse shoulder head-to-shoulder pattern. The bears are trying to push the price below the breakout level. If they do, it would suggest an increase above $6.08 could be a bull trap. This could push the price towards the 20-day EMA ($5.39). If the price bounces back strongly from this level, it could increase the chances of a break above $6.62. The pair could gain momentum later and it could rise towards the $8.78 pattern target. Conversely, if the price dips below the moving averages, it indicates weakening of the bullish momentum.

Looking at the 4-Hour chart, the bears pushed the price below the $6.08 breakout level, but the strong rebound from the 20-EMA indicates aggressive buying at the lower levels. Buyers will make another attempt to push the price above $6.62 and resume the uptrend. Contrary to this assumption, if the price drops and breaks below the 20-EMA, it will indicate that the bears are trying to trap the aggressive bulls. The altcoin could then drop to the 50-SMA. If this level is also broken, the drop could be extended to $4.60.
Internet Computer (ICP)
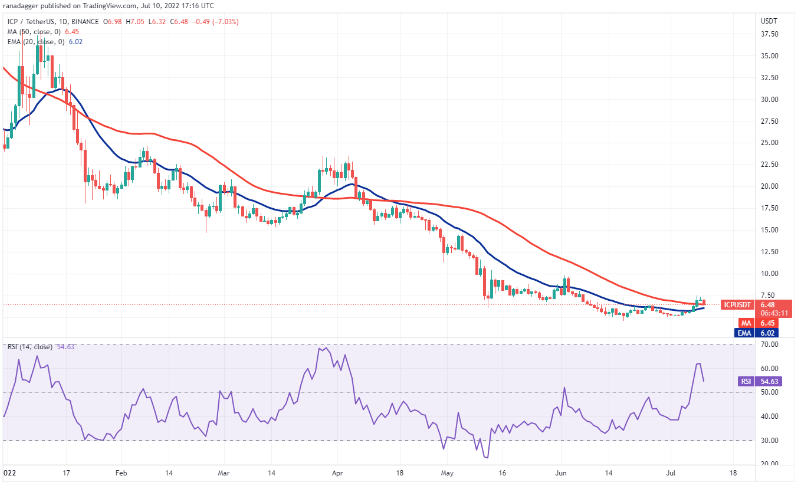
Internet Computer (ICP) broke above the 50-day SMA ($6.48) on July 8, indicating that the bulls are attempting a bottom. The moving averages are close to completing the bullish crossover and the RSI is in the positive territory, suggesting that the bears may be losing control. If the price bounces back from the moving averages, it indicates that the bulls have turned the level to support. This could open the doors for a possible rally to the $10 psychological level where the bears could pose a strong challenge again. Alternatively, if the price declines and breaks below the moving averages, it will indicate that the bears are continuing to sell aggressively higher. The ICP/USDT pair could drop to $5, which is likely to act as strong support later on.

Looking at the 4-hour chart, long wicks on a few candlesticks above $7 indicate that the bears have not given up yet and continue to sell on rallies. The bears have pushed the price back below the 20-EMA, but a minor positivity is that the bulls are buying the dip aggressively. This indicates that demand is at lower levels. Buyers are trying to push the price above the 20-EMA. If they are successful, the pair could rally to $6.70 and later to $7. Contrary to this assumption, the pair could slide towards the 50-SMA if the price breaks through the overhead resistance and drops below $6.30.
AAVE (AAVE)
Aave’s recovery above the 50-day SMA ($79) on July 9 indicates a possible change in trend. The 20-day EMA ($68) has started to rise and the RSI is in the positive zone, which indicates that the bulls are trying to gain the upper hand. If the bulls sustain the price above the 50-day SMA, the AAVE/USDT pair could gain momentum and rise to the psychological resistance at $100. This level could act as a strong hurdle, but if the bulls stop the next drop above the 50-day SMA, it indicates that the buyers are back in the game. The altcoin could then attempt a rally to $120. Contrary to this assumption, if the price stays below the 50-day SMA, it will indicate that the bears continue to sell in the rallies.

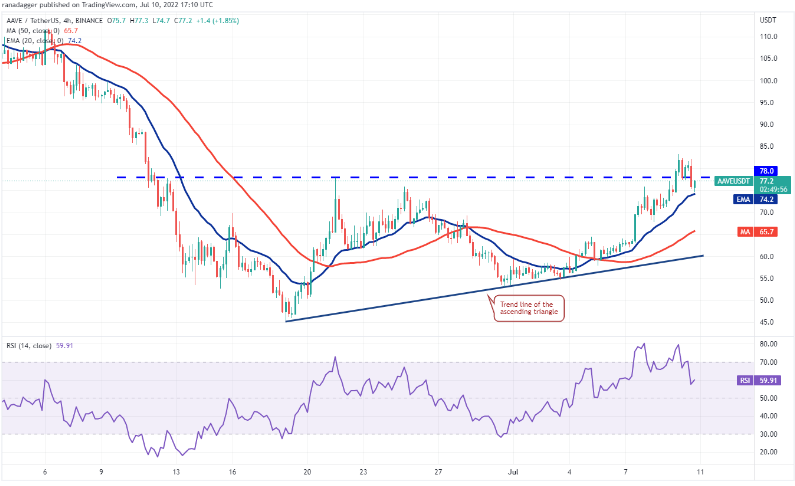
The 4-hour chart shows the altcoin project breaking above $78 and completing the ascending triangle pattern. The bears have pushed the price back below the breakout level, but the fact that buyers are defending the 20-EMA is a positive sign. If the price rises and rises above $83, the altcoin could pick up momentum and rise to $93. The pattern target of this bullish setup is $110. The bears will need to push the price below the 20-EMA to invalidate this positive view. This could open the doors for a possible drop to the 50-SMA.
Last altcoin on the list: Quant (QNT)
Quant (QNT) has risen sharply over the past few days, suggesting that there might be a bottom. The momentum picked up after buyers pushed the price above $67. The moving averages have completed a bullish crossover and the RSI is in the positive territory, pointing to a possible trend reversal. The up move is facing a strong hurdle near $90. If the price declines from this resistance, but bounces back from the 20-day EMA ($64), it indicates that sentiment has turned positive and investors are buying on dips. This could raise the probability of a rally to the psychological level of $100. This positive sentiment could be invalidated in the short term if the price continues to decline and slides below $67.

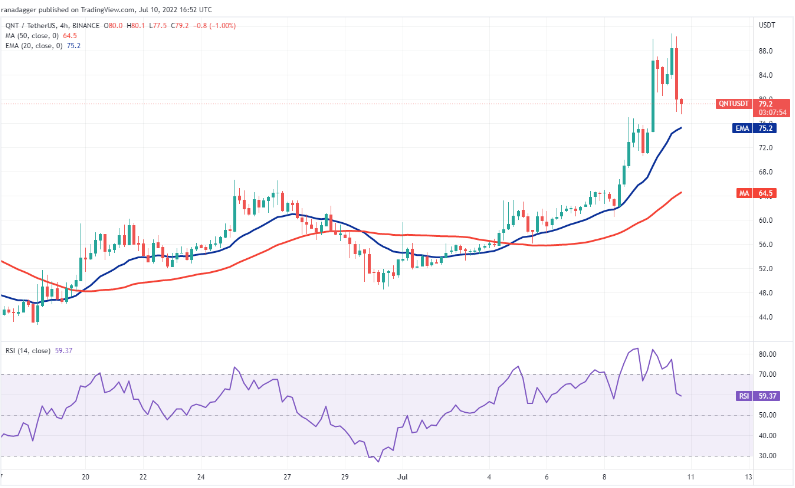
Sellers are trying to stop the rise at $90 but the rising moving averages and the RSI in the positive zone suggest that the bulls have the upper hand. If the price bounces back from the 20-EMA, buyers can push the price back towards $90. A break and close above this resistance could signal a resumption of the short-term uptrend. This positive view may be invalidated in the short term if the price drops and breaks below the 20-EMA. The pair could then drop to the 50-SMA.