
Gold prices slumped on Friday despite treasury yields falling as the dollar rose. However, the price closed the third week in a row with a rise. Technical analyst Ross Burland evaluates the technical picture of gold. On the crypto front, Bitcoin is struggling to break above the overhead resistance of $31,000. However, according to crypto analyst Rakesh Upadhyay, it is positive that the bulls did not allow the price to drop below the $29,500 support.
For gold prices, eyes will be on the Federal Reserve!
The US dollar rose over the weekend, making gold more expensive for international buyers. Also, the third day of low closes in the gold price comes ahead of the Federal Reserve’s policy committee’s two-day meeting next week. Expectations are for the Fed to increase US interest rates by 25 basis points. That said, it’s the medium and long term that matters to most gold investors. But after reports of inflation and the economy slowing, few expect the central bank to raise interest rates further this year. What’s more, some have begun to wait for it to start pulling back on rate hikes in the new year. On the other hand, TD Securities analysts make the following assessment:
After the Fed’s pause decision in June, it is expected to continue to increase interest rates next week. While we anticipate that July will bring the last rate hike of this cycle, we do not think that the Committee is comfortable in signaling this change yet. Indeed, Fed Chairman Jerome Powell will likely reiterate that an additional rate hike is still valid this year.
Gold price weekly and daily charts
This leaves the gold price at a crossroads on the charts, and it can go either way. Although gold prices declined on Friday, they closed the third week in a row with an increase.
The wick leaves bullish prospects on the lower timeframes as below.
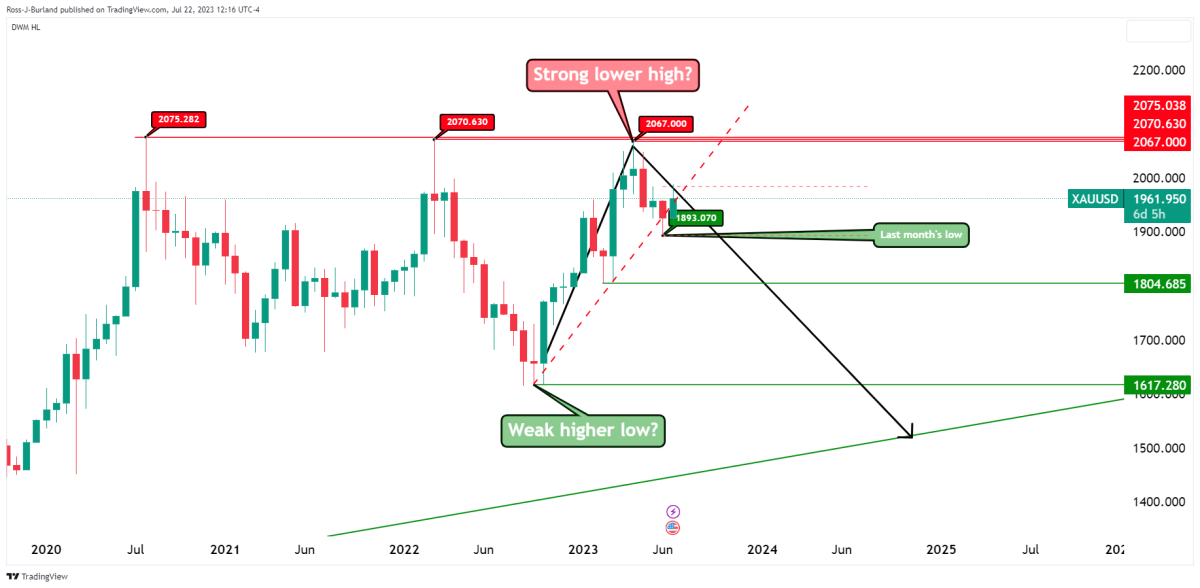
In the 3-week charts below, we can see that the gold price has been unable to top higher in the bullish cycle so far.
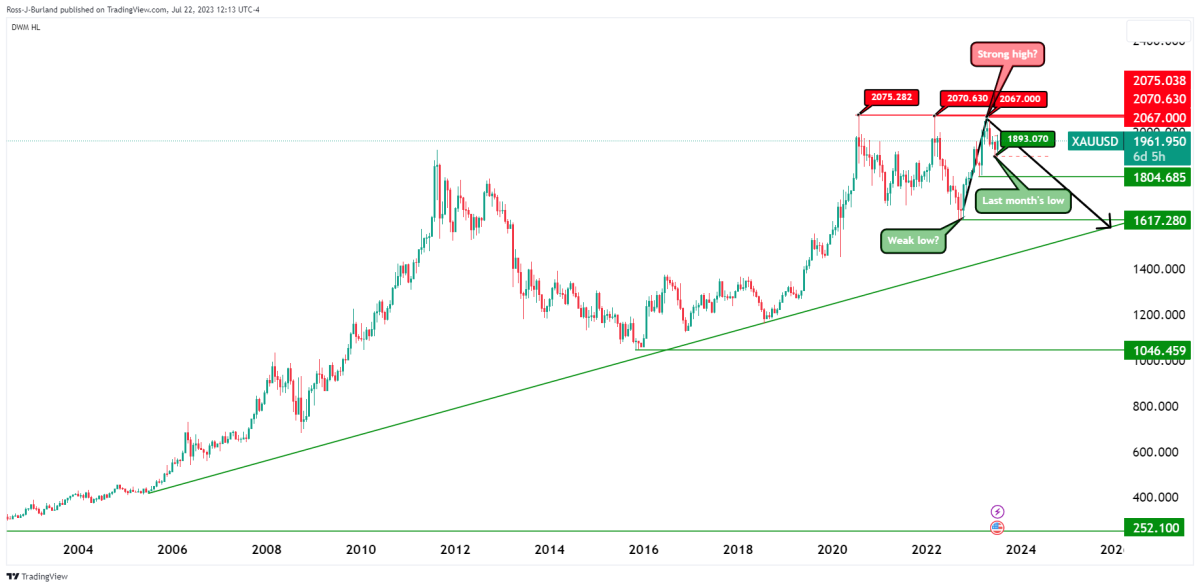
If the bears commit, there is a risk of a significant decline in gold price towards the dominant trendline support and breaking the key structure near $1,617.
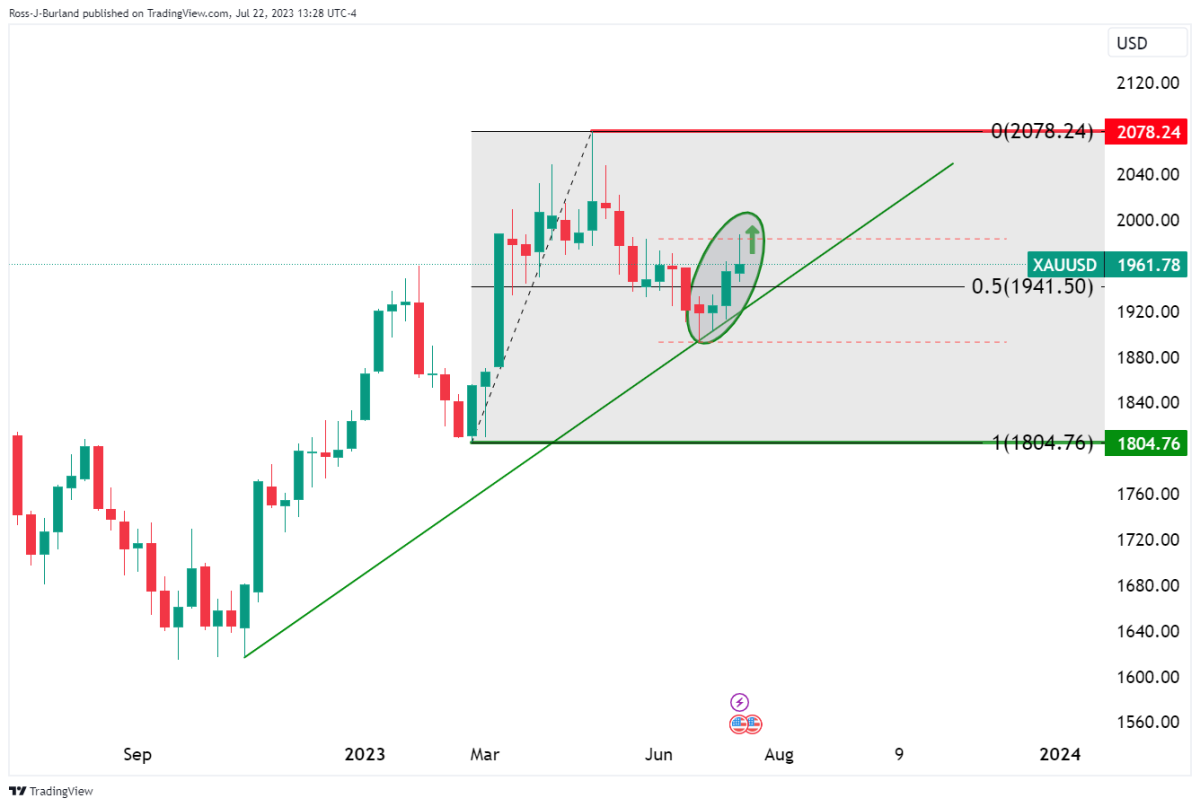
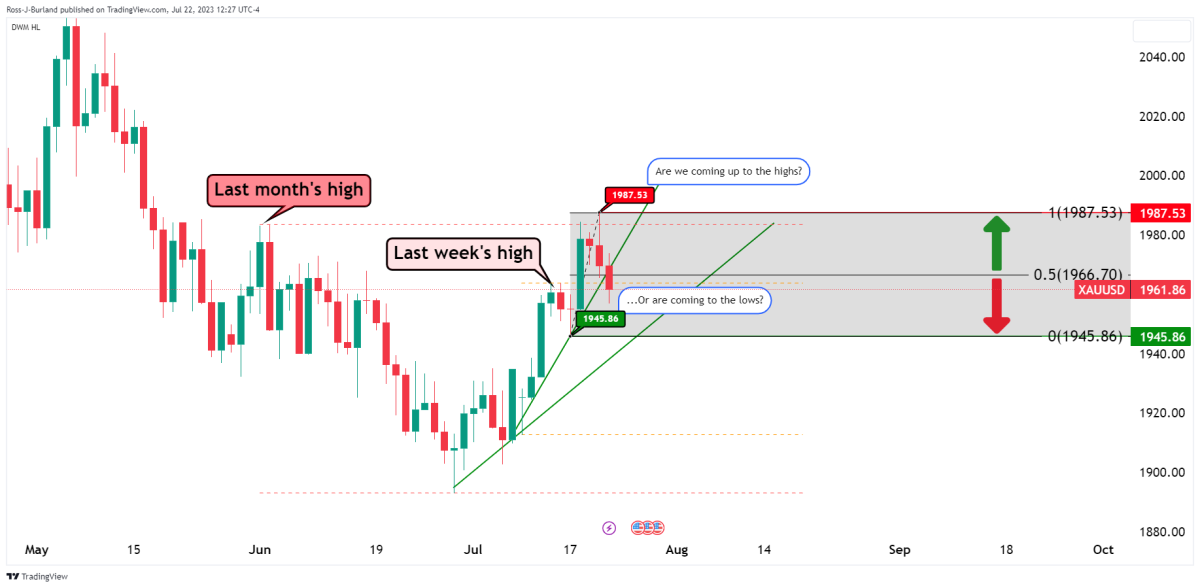
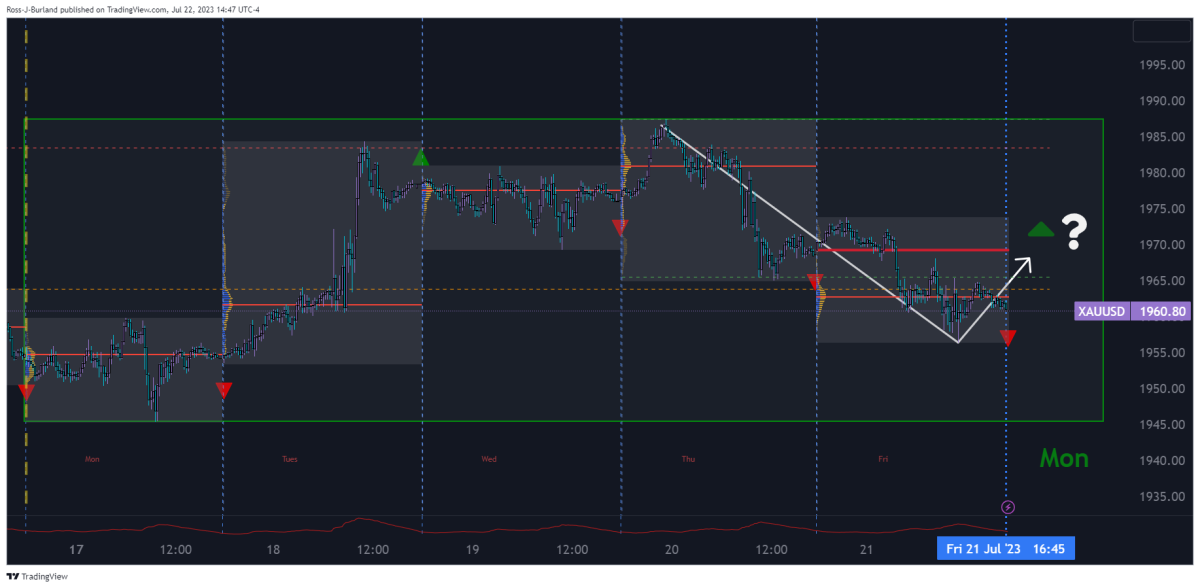
The gold price is at a crossroads.
Meanwhile, if we go back to the short-term outlook, we can see that the gold price is at a crossroads.
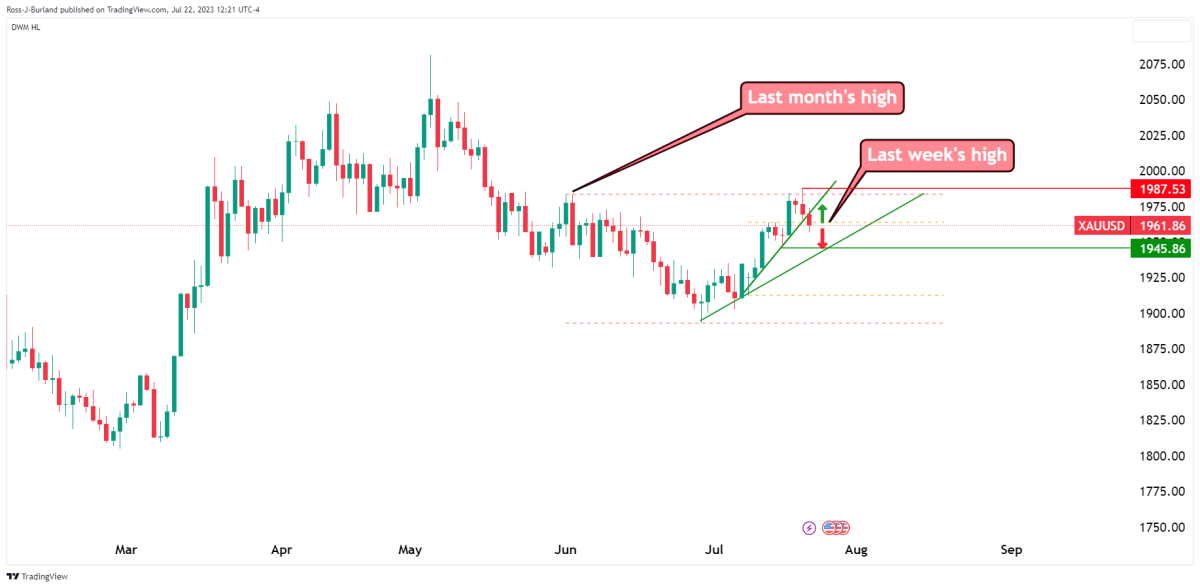
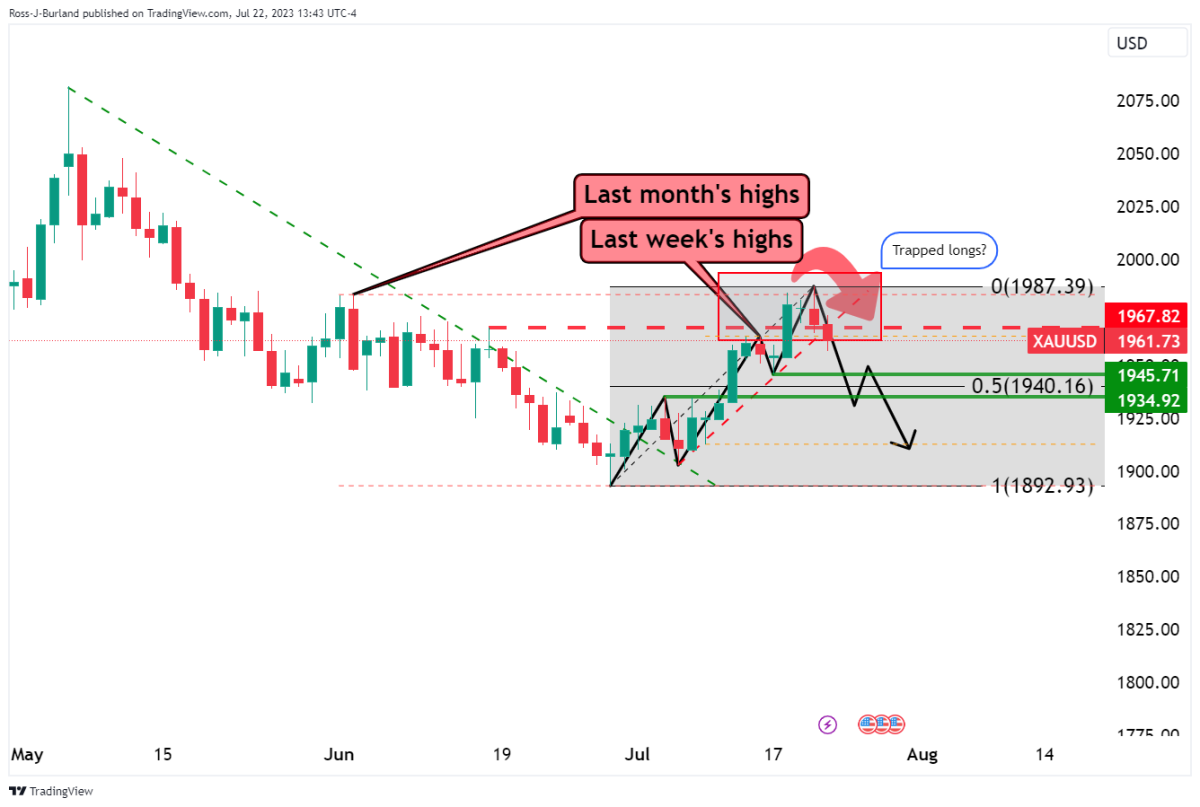
Price broke last week’s and month’s highs. But he can’t convince as the bears take action. The correction could head towards a test of the recent structural lows near $1,945:
Gold price, bearish view
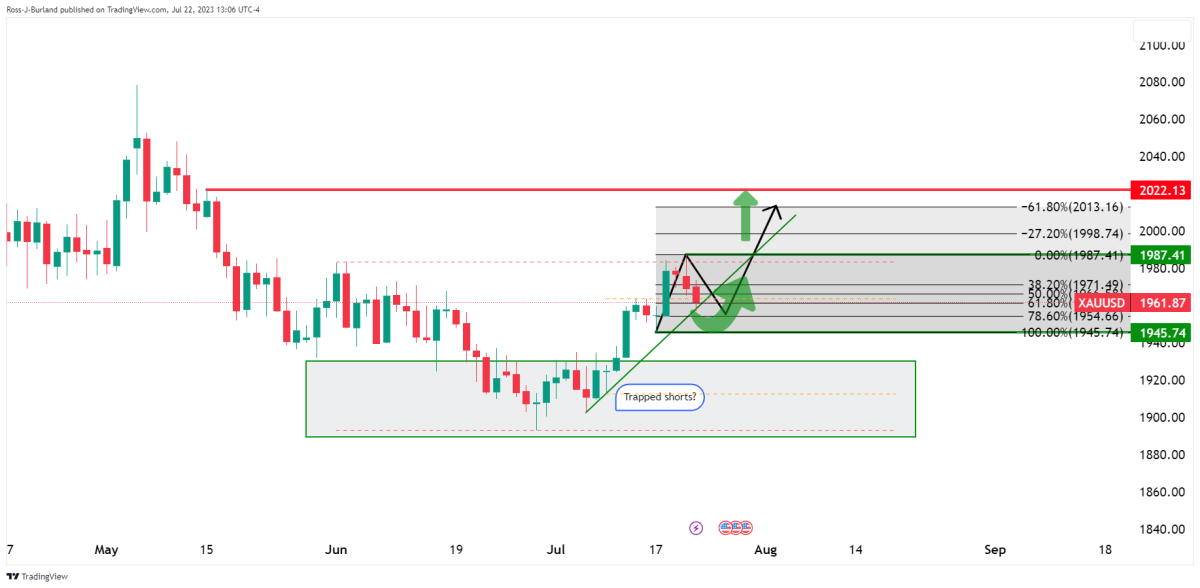
Uptrend in gold prices
On the other hand, the gold price regained its northern trajectory. Accordingly, we can see that it closed above the highs of the last month.
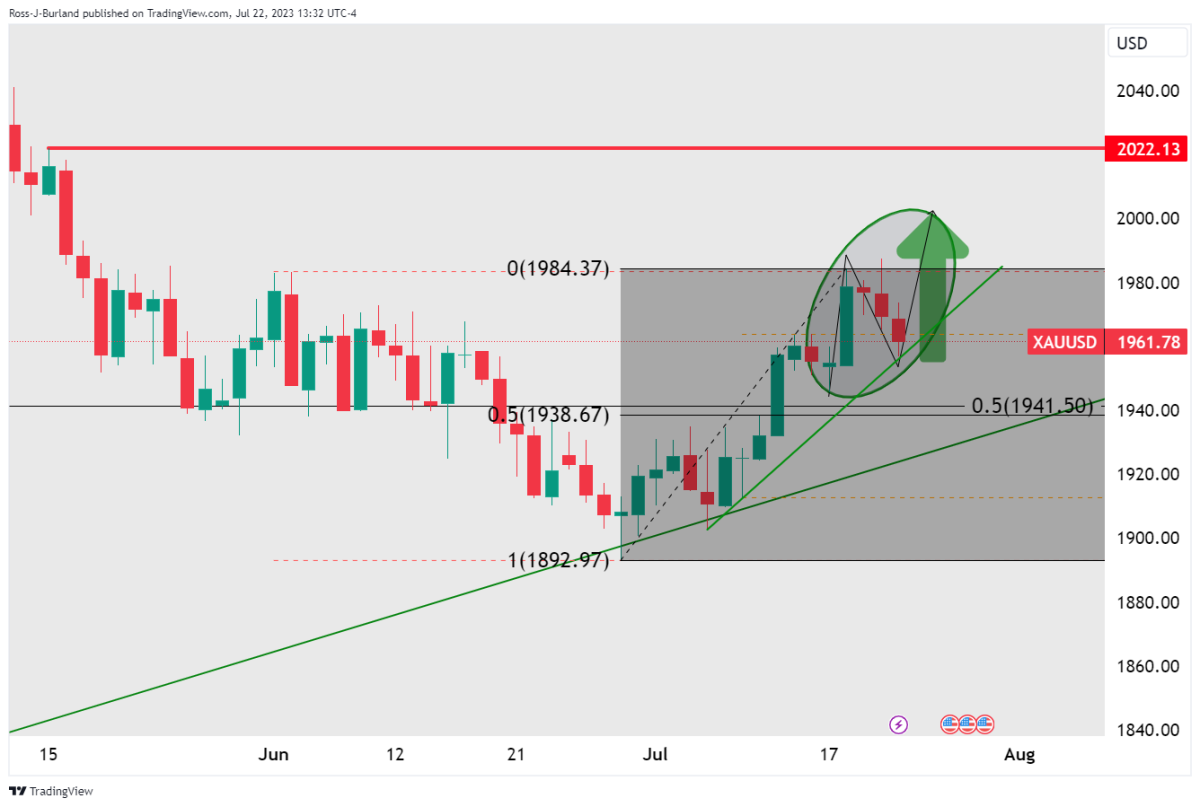
Gold price opening range expectations
Starting the week on Monday, it’s worth noting that the week’s and last month’s highs were unsuccessfully broken on Thursday. After that, the yellow metal fell for two consecutive days. Thus, low closings took place on the third day as well. On Friday, it continued to break the previous day’s and week’s lows. All this gives us information:
- Long positions are stuck high.
- The shorts are in the snow.
- We had three sessions of declines on Friday that broke the previous week’s lows.
All of this points to a ‘short squeeze’ to trap the bears for the first balance from below the previous week’s and Thursday’s lows:
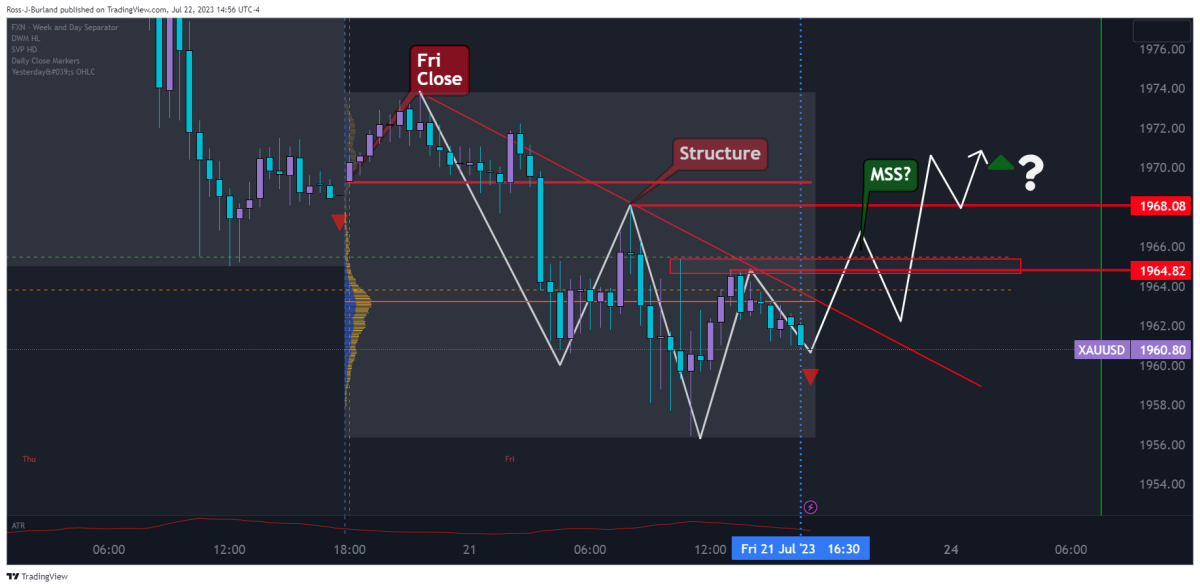
15 and 30 minute charts as above and below.
Bitcoin (BTC) price analysis
Bitcoin has been holding steady below the 20-day exponential moving average ($30,036) for the past few days. However, the fact that the bears were unable to lower the price to the 50-day simple moving average ($28,979) is a positive sign.
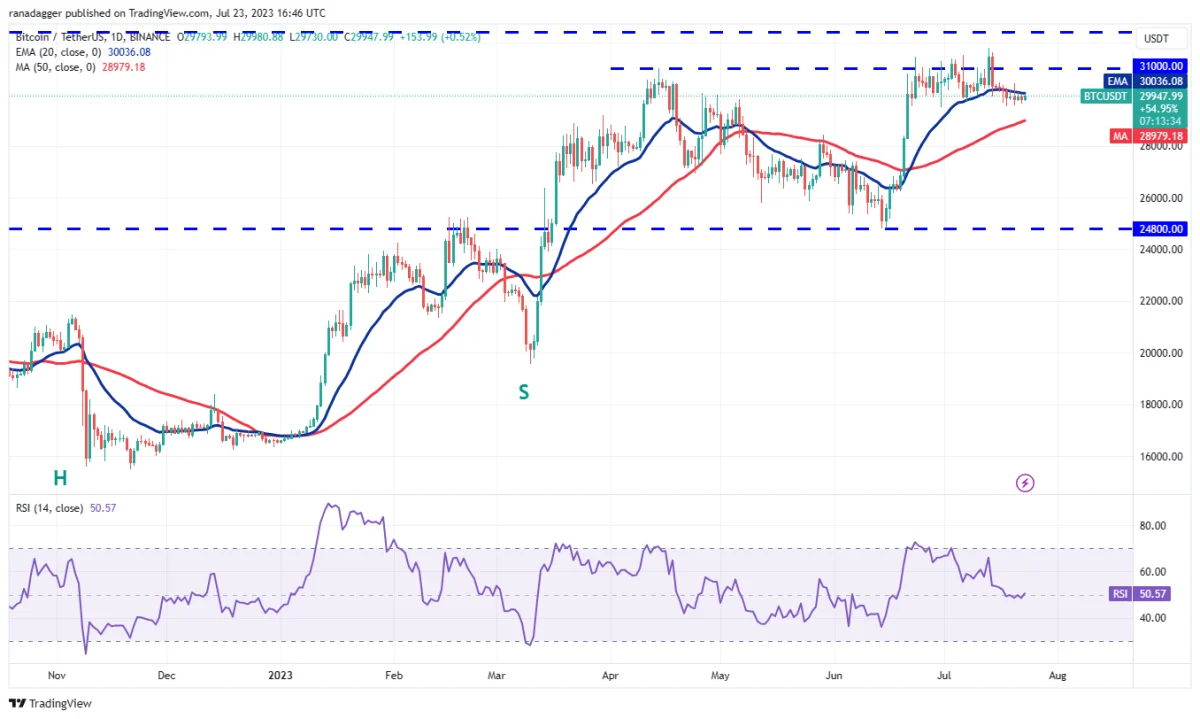 BTC daily chart. Source TradingView
This shows that the bulls are not giving up and are buying on every small drop. It is possible that the bears’ repeated failure to drive BTC down is likely to attract buyers. If the price rises above the 20-day EMA, BTC is likely to rally towards the overhead resistance of $31,000. A break above the $31,000-$32,400 zone could open the way for a possible rally to $40,000. On the other hand, if the price drops and breaks below the 50-day SMA, it will indicate that the bears are making a comeback. BTC is likely to drop towards the $24,800 support later on.
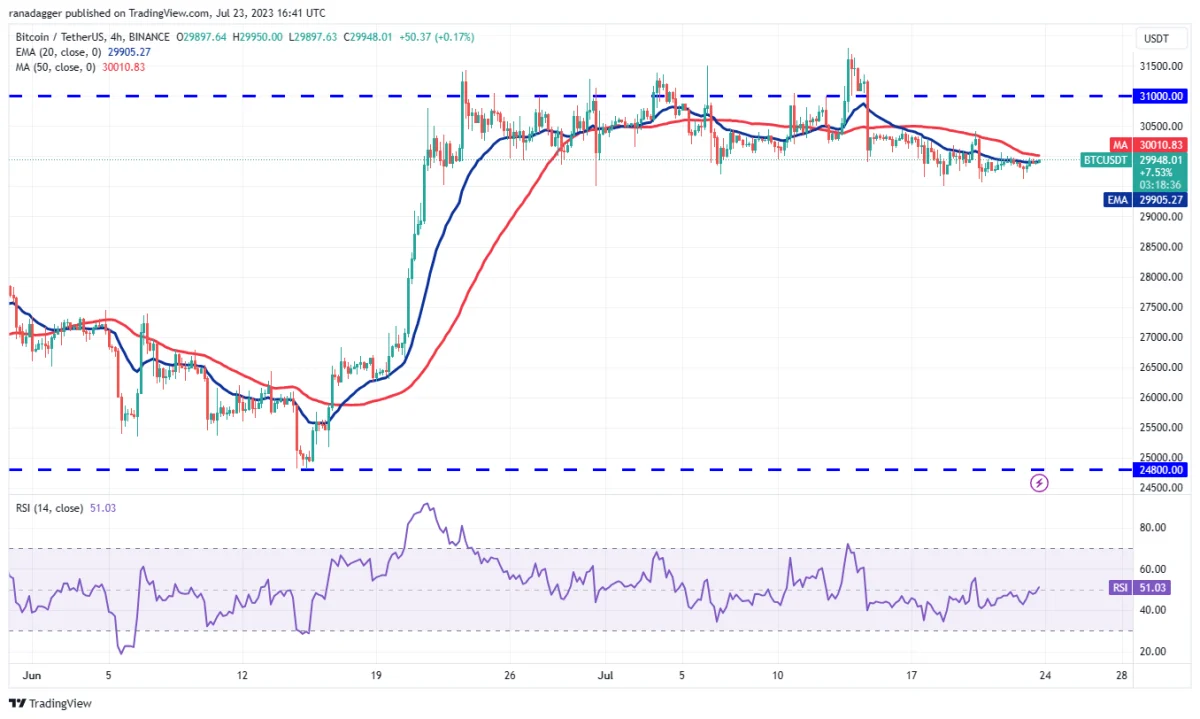 BTC 4-hour chart. Source TradingView
The moving averages on the four-hour chart are flattening. Also, the relative strength index (RSI) has risen to the midpoint. This shows that the range-based movement will continue for a while. If the bulls push the price above the 50-day SMA, it is possible for BTC to attempt a rise to $30,500. Then it is likely to head towards $31,000. Important support to watch on the downside is $29,500. If this level falls, BTC is likely to drop to $27,500.


