We are looking at the gold and Bitcoin charts of the week. Thus, we will try to make some important inferences with before and after. Let’s have a look at the details.
Gold chart of the week
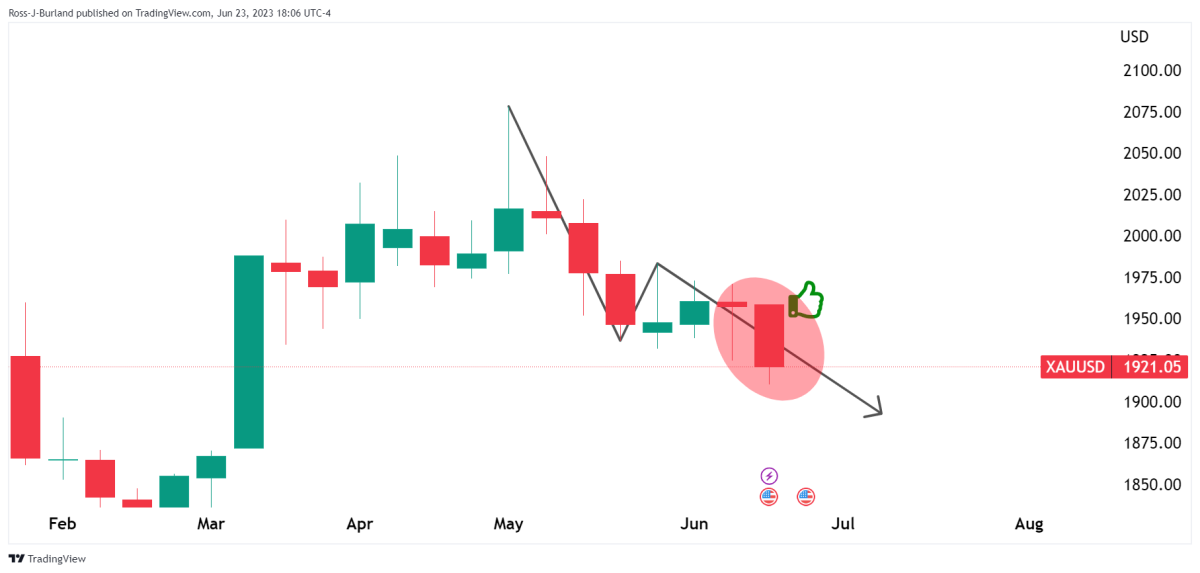
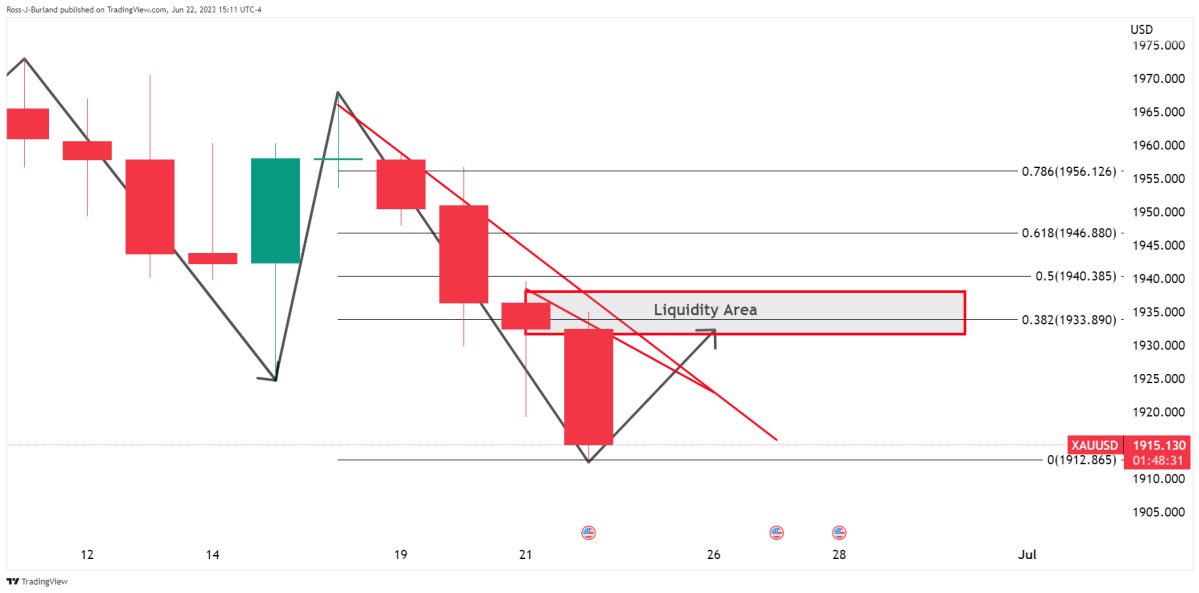
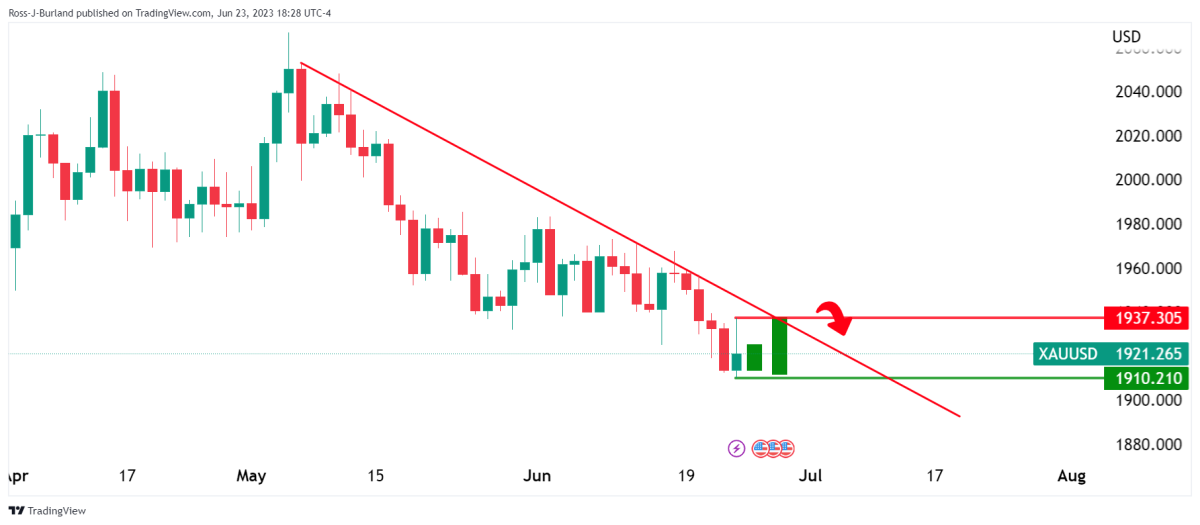
When we look at the gold chart of the week, the spiral and the break are clearly in sight.
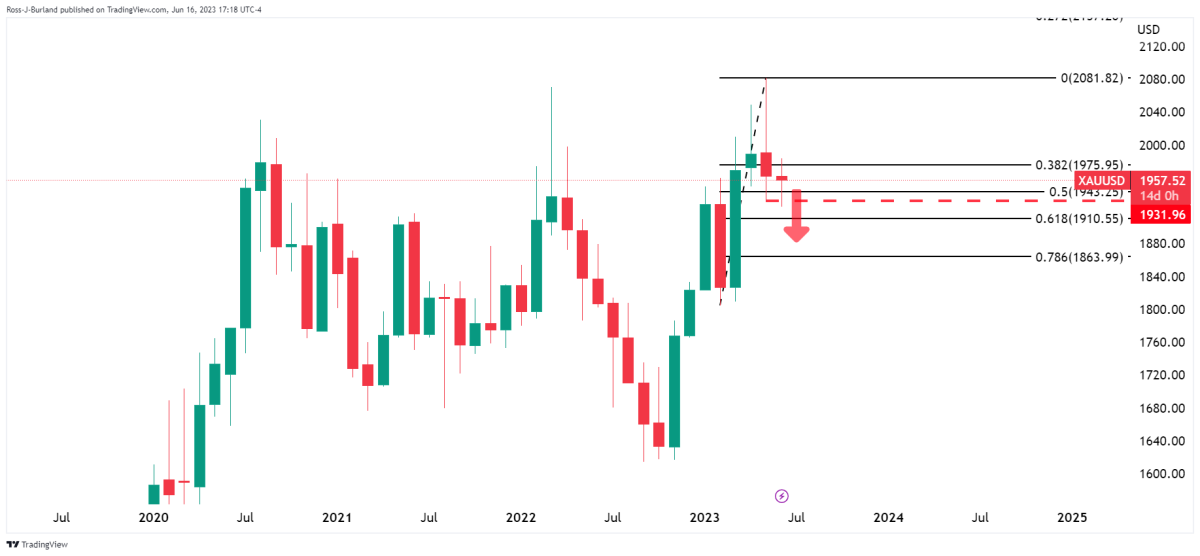
It is in question that the monthly chart is in a bearish trend and the bears are observing the 61.8% Fibonacci target.
The target for this month was $1,910. As we enter the last week of the month, we have already reached this level.
It is mentioned in the chart that the weekly chart favors a lower move.
So far everything is fine.
Gold price analysis: Bulls await a correction, US PMIs will be key
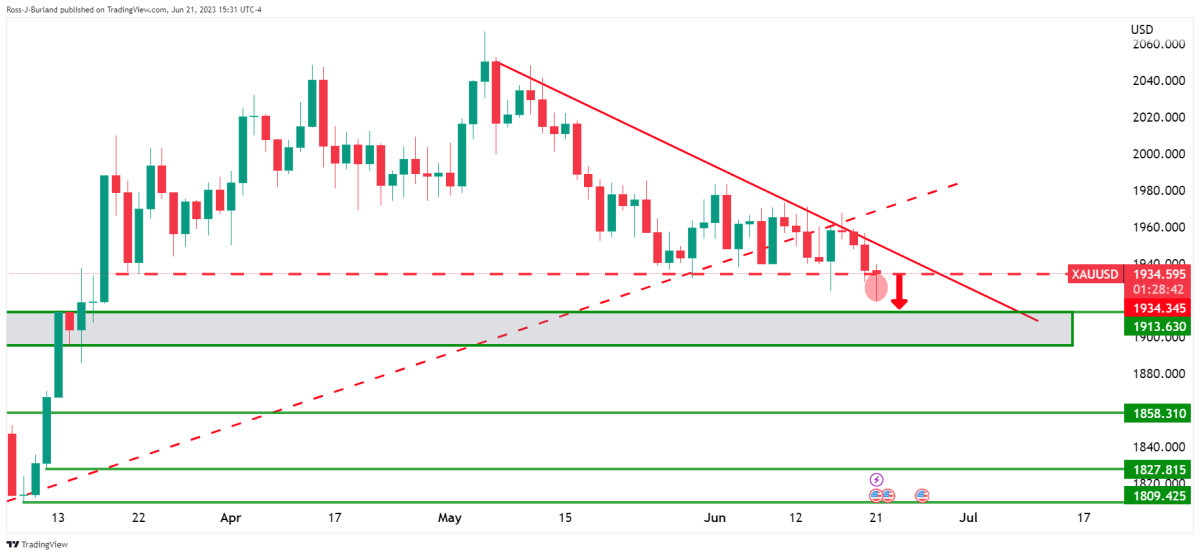
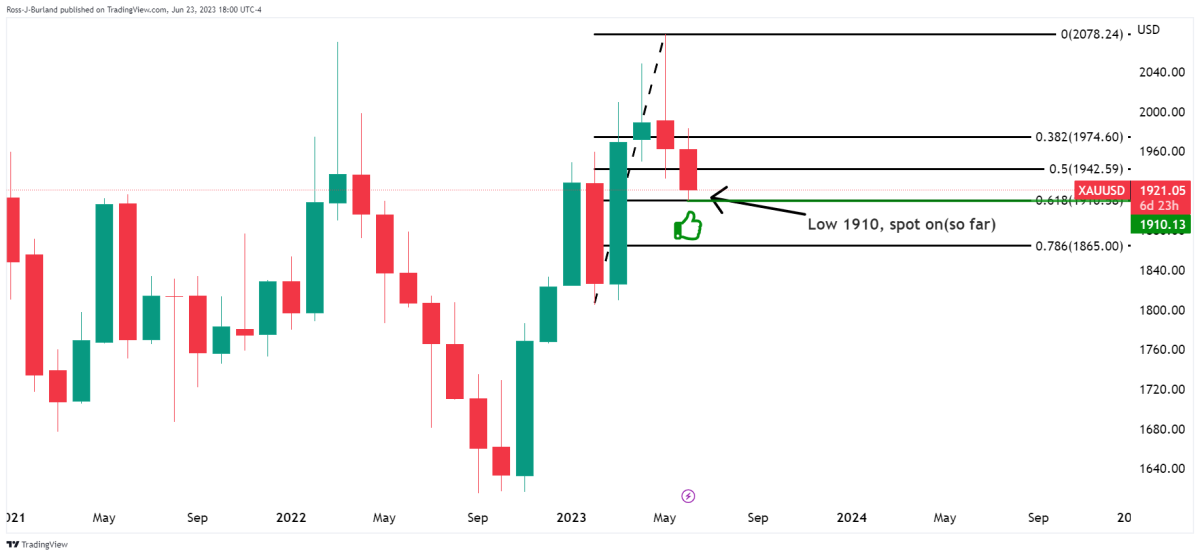
“From a daily perspective, we continue to test lows while on the front of the downtrend. There is a possibility that the wick on the chart will fill in the next session. Accordingly, this will be the catalyst for a sell-off program towards $1,913 and around support.” It has expressions.
As shown, weekly and daily chart analysis took place.
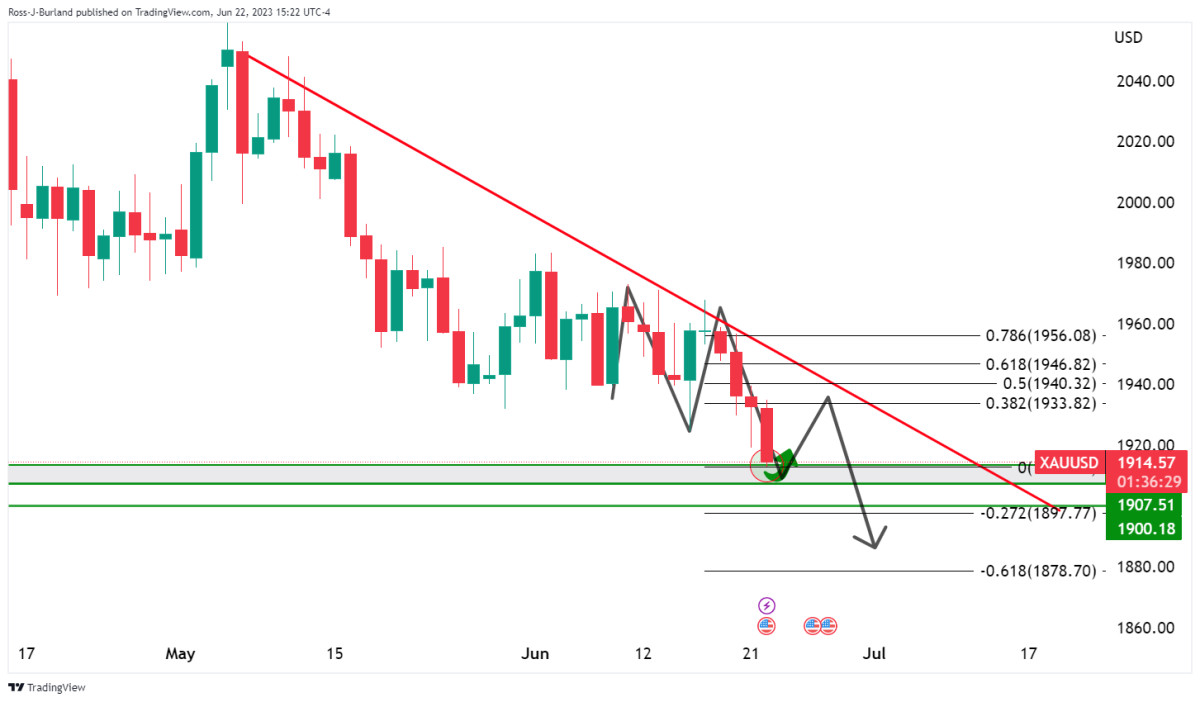
Next, we look at the statement that “at this point we may see a reversal towards the neckline of the M pattern”.
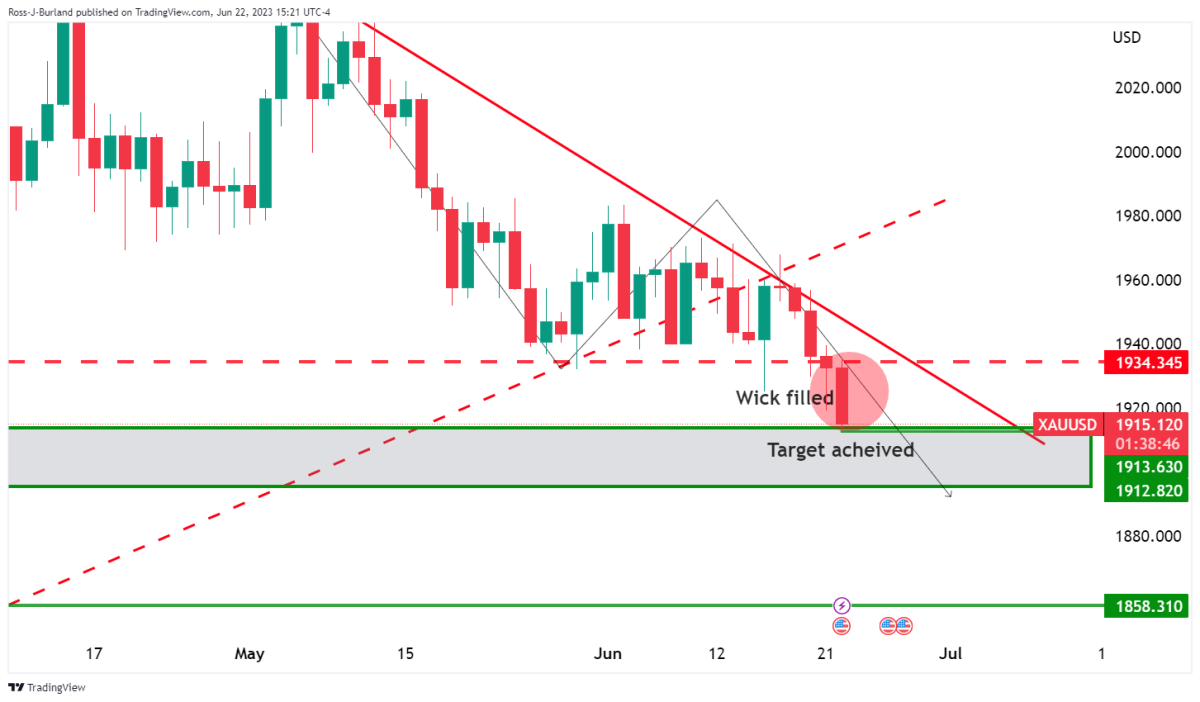
On the other hand, let’s note that $1,880 will be fragile if the bears grind their teeth:
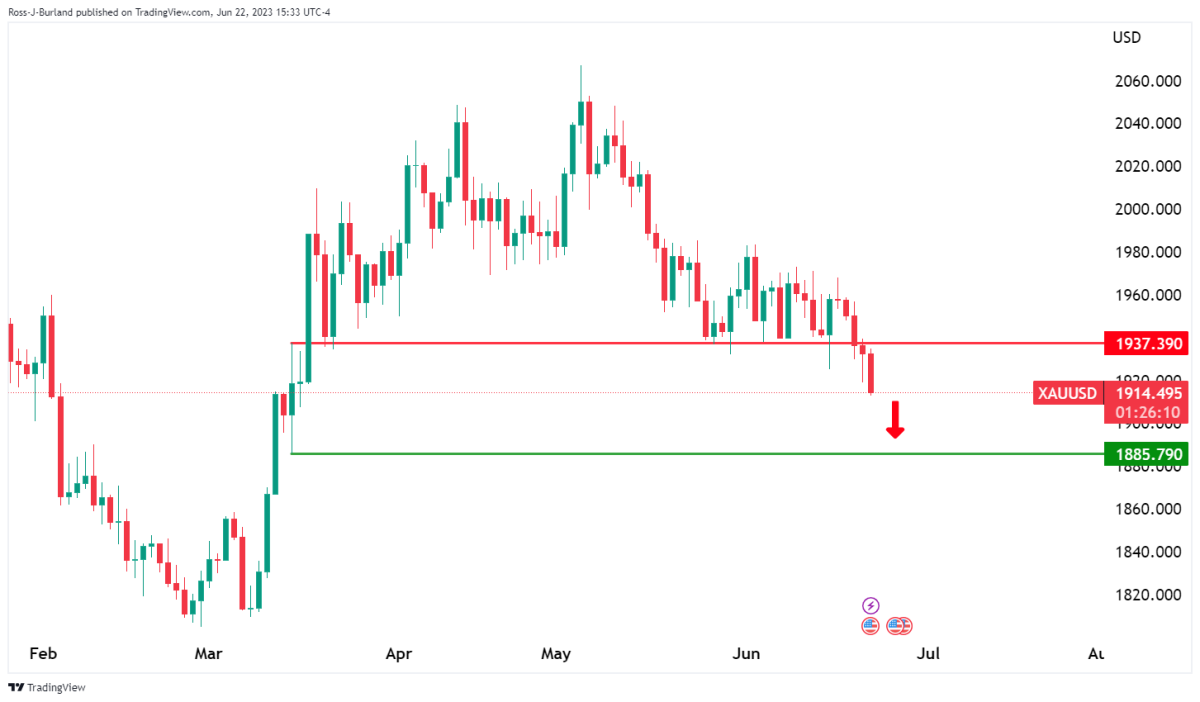
In any case, $1,937 is reserved:
The target has been accomplished.
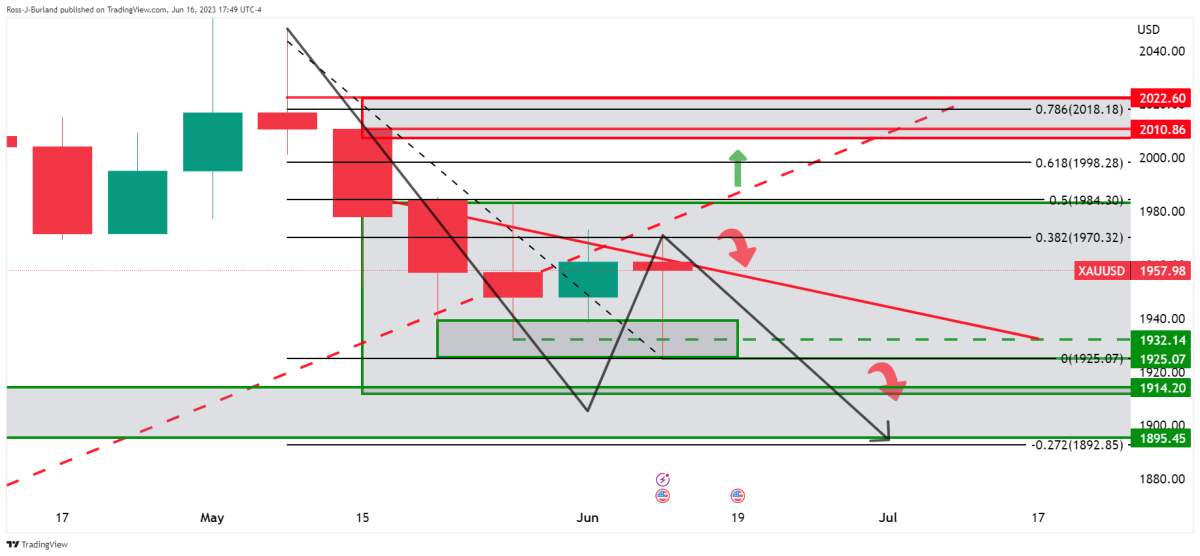
Gold price, what’s next?
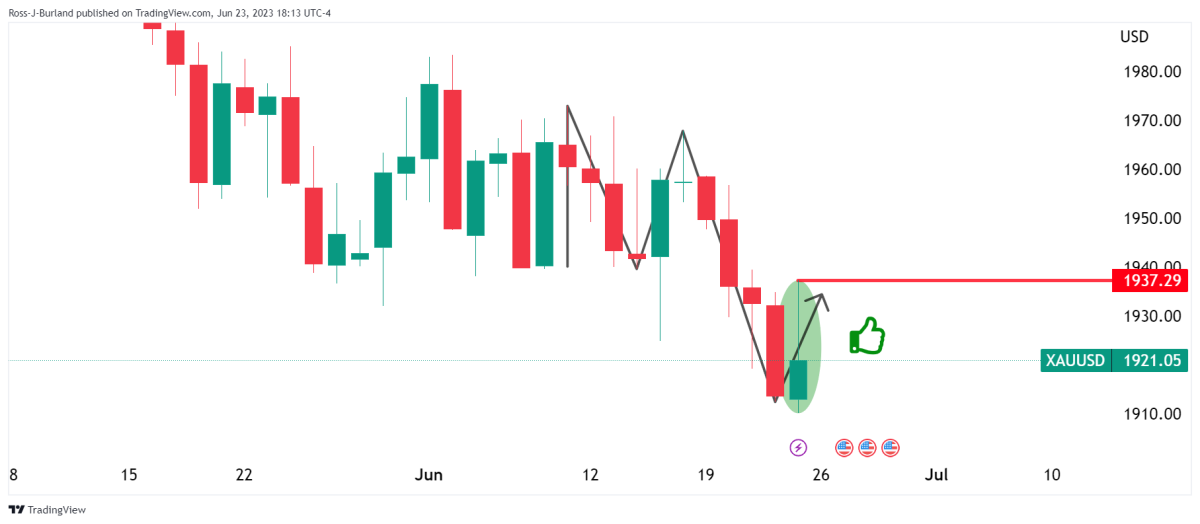
Meanwhile, we think Gold price will continue to be supported and at least fill the wick on Friday and may be slightly higher. The opening balance will play a key role in this. For example, a day inside on a Monday or Tuesday will lead to a significant rise from Friday’s lows to break the lower time trendline resistance with a solid daily close.
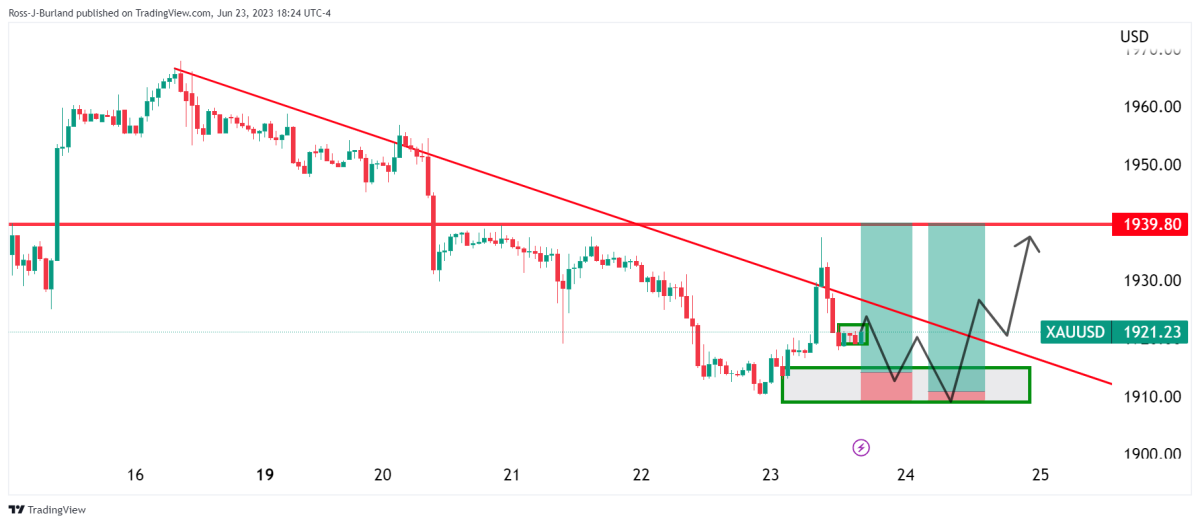
Markets digest mixed emotions surrounding the Federal Reserve and the Global/US economy. By absorbing sell-side liquidity as downside fuel (long-term bearish, see chart below), we could see a more thorough test of the neckline of M-formations.
Analysts at TD Securities have this to say about the Gold price.
Investors remain bearish in the precious metals complex amid the hawkish trend of global central banks, especially after the BoE’s latest rate hike. Indeed, price movements in the yellow metal following the Fed decision suggest that investors are not as skeptical as initially expected about the Fed’s hawkish communications. Rate pricing also remained fairly stable at just over 70% probability of a return to hikes in July. However, economic data will be key to the gold outlook going forward. Therefore, we expect gold to perform quite well in the coming months.
Analysts say global data will continue to deteriorate enough to keep Golden bears in a cage.
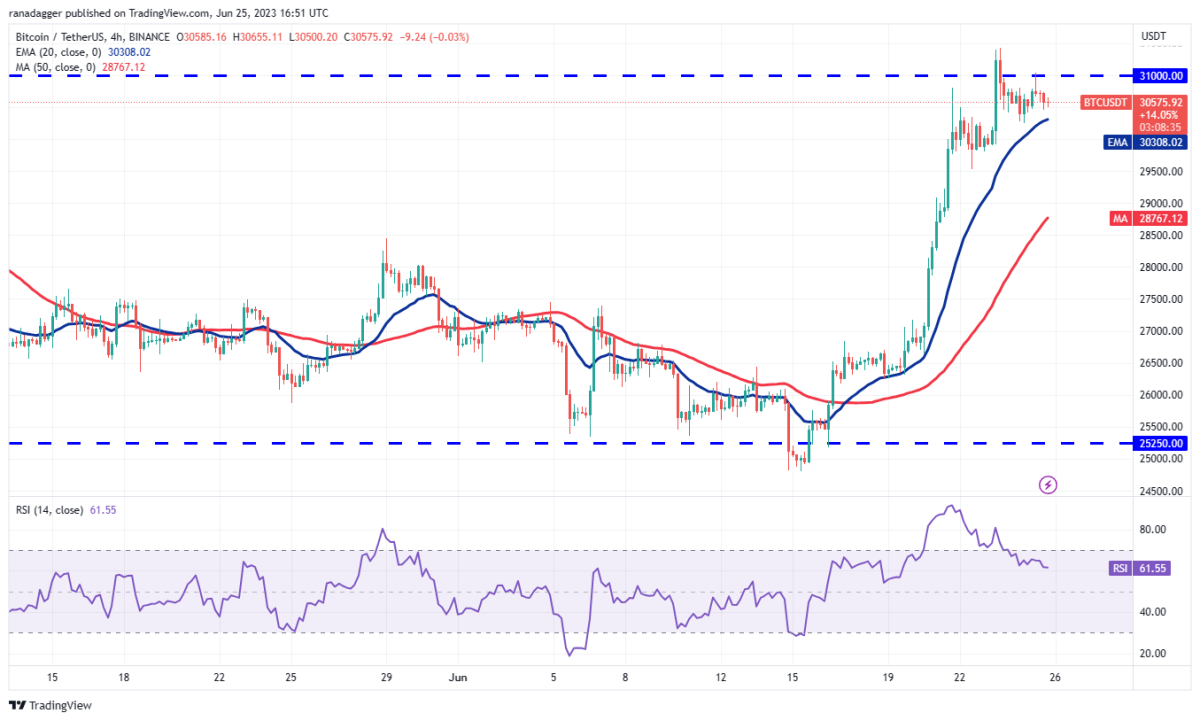
What does the bitcoin chart say?
The bulls are in favourite, as the moving average and RSI signal strength. The presence of the ascending 20-day exponential moving average ($28,085) and the overbought RSI points to an advantage for the bulls. If buyers can push the price above $31,000 and protect it, it will mark the start of the next leg of an uptrend for the BTC/USDT pair. Although the $32,400 resistance poses a challenge. It will likely be surpassed and push the pair towards $40,000.
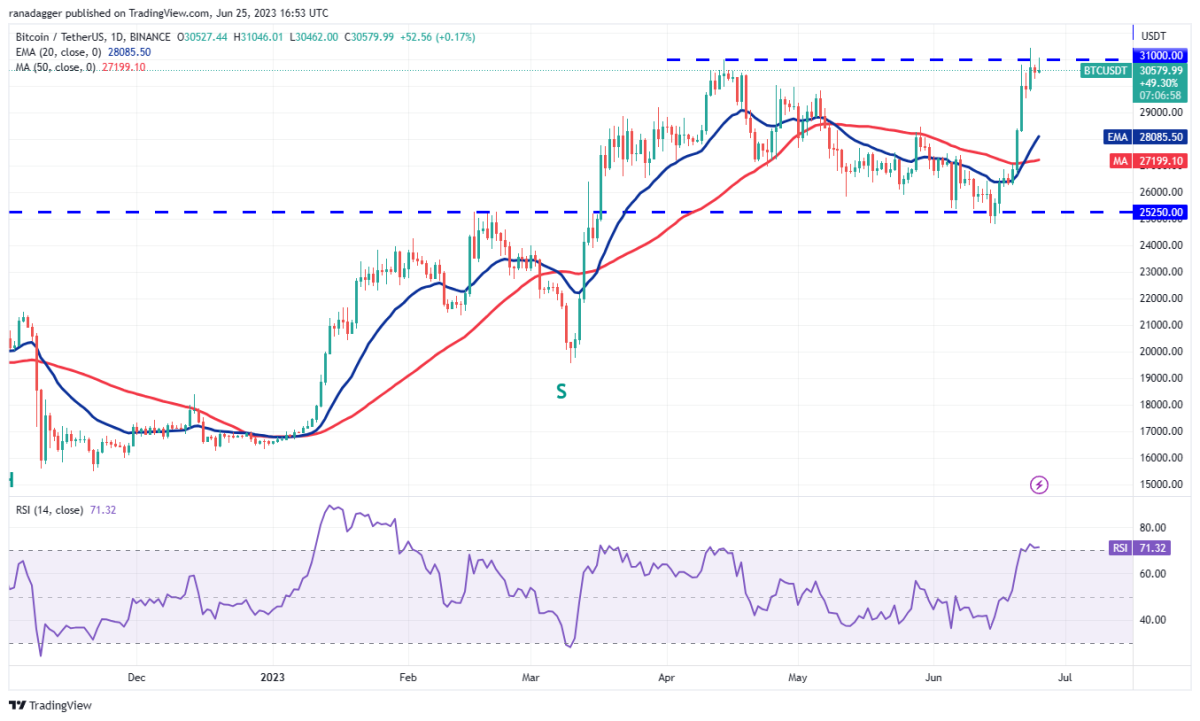
The main support and warning signs to follow are as follows. A break and a close below the $29,500 level will be the first indication of weakness. In such a scenario, the pair will pull back towards the 20-day EMA, which remains a critical level to watch. If the support at the 20-day EMA fades, further downside moves will lead to a potential drop to the 50-day simple moving average ($27,199).
Expectation of a breakout from the current range
Looking at Kriptokoin.com, the BTC/USDT rate is stuck between the 20-day EMA and the $31,000 level. However, this narrow-range trading is unlikely to continue for long. Accordingly, a breakout of the price above the $31,000-$31,500 zone will trigger the next phase of the uptrend. Conversely, if the price drops below the 20-day EMA and continues to decline, it will trigger short-term traders’ stop-loss orders. This will potentially lead the pair towards $29,500, where strong support from the bulls is expected. However, a break below this level will open the doors for a potential drop towards the 50-day SMA.