In light of the latest developments in the global markets and the crypto market, experts are predicting bullishness for some altcoin projects. We have compiled the opinions and predictions of experts for our readers.
Dogecoin (DOGE) parabolic run coming?
According to analysts, there is a chance that Dogecoin (DOGE) will witness an unannounced parabolic price surge in the near to medium term. This projection is confirmed by data displayed from crypto analytics provider IntoTheBlock, which shows a growing concentration of whales for Dogecoin.
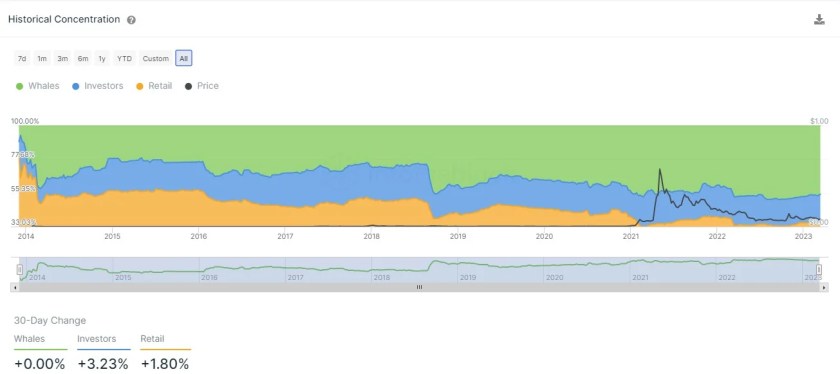 Image Source: IntoTheBlock
According to the data, whales currently hold 45.53% of the total DOGE supply, worth 63 billion units, as we reported on cryptokoin.com. This stands out compared to the 35.31% attributed to individual owners. According to analysts, if there is a further increase in these whale holdings, there could be a typical big increase in the price of DOGE in the near term.
What does the Whales LINK game mean?
According to ON-chain analytics platform Lookonchain, whales are currently accumulating LINK. He states that 30 new addresses (which may belong to the same whale, although not certain) have purchased a total of 2,645,590 LINK worth $18.52 million from Binance in the past two weeks.
Chainlink has been in a steady rise since March 10, when the price found a bottom at the $5.90 support. From there, Chainlink continued to mark eight of the eleven days as green days, breaking key hurdles at the MA 50 and 200 ($7.06 and $6.93, respectively). According to analysts, the recent whale accumulation in the last two weeks seems to have positively affected the price of LINK. The recent increase is also supported by the positive crossing of these moving averages. According to analysts, the altcoin could target the $8.2 and $8.4 levels if its current uptrend continues. Meanwhile, the daily RSI is rising above the neutral level of 50, indicating an advantage for the bulls.

This altcoin will continue to recover
Crypto analyst Aaryamann Shrivastava assesses the technical outlook for SAND price. The sandbox price, trading at $0.681, has risen close to 30% over the past eight days. The rise in price allowed the altcoin to regain the support of the 50- and 100-day Exponential Moving Averages (EMA), which served as a solid foundation for recovery. The crossing of these EMAs with $0.676 has set the critical support level for SAND. Looking at the price indicators, the narrative seems to be bullish at the moment. The Parabolic Stop and Reverse (SAR) indicator is still showing an uptrend.
The presence of the blue dots of the indicator below the candlesticks is also proof of this. The Relative Strength Index (RSI) is also above the neutral line at 50.0. If the indicator bounces off this line, an uptrend is possible. Therefore, pressure from bull traders could allow the altcoin to protect $0.676 as critical support and tag the resistance level at $0.718. The level marks the 50.0 Fibonacci retracement from $0.782 to $0.533. Turning it to a support base would break the 200-day EMA and mark a 20% rally, allowing it to rise above the critical resistance level of $0.815.
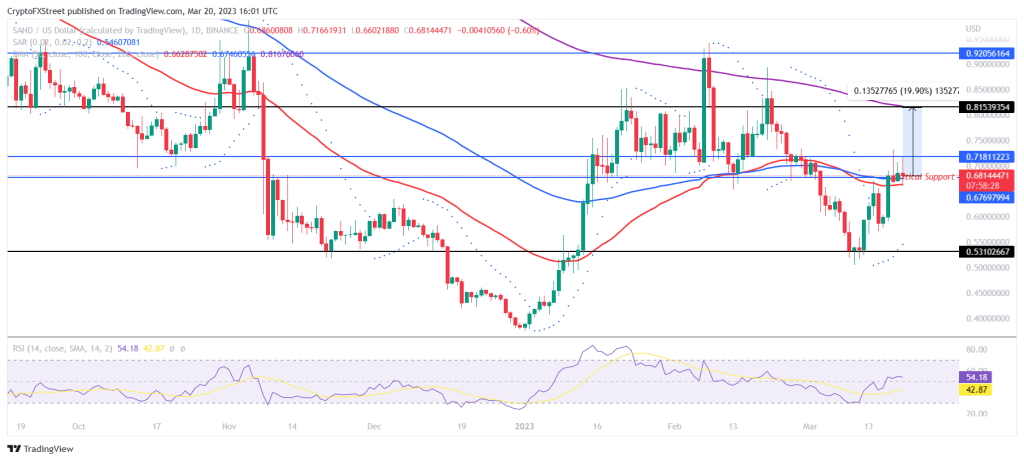 SAND 1-day chart
However, if the trend changes and the SAND falls above critical support, the altcoin could see some decline. In this case, SAND price may be susceptible to a 22% collapse towards the March low of $0.531.
This altcoin is pumping on a hype
Analyst Lockridge Okoth looks at AXS’ techniques. AXS price is heading north on a recovery journey that could see the gaming token return to its January 22 high of around $12.56. At the time of writing, token auctions at $8.81 use the $8.64 support level as a jumping off point to meet the 50-day Exponential Moving Average (EMA) at $9.16.
An increase in buyer momentum above this level could see the altcoin price tag at $9.37 by the horizontal line and the 100-days EMA. After crossing this level, AXS could rush towards the next barrier at $10.94, up about 24% from the current value. This level was last tested around February. In extremely bullish situations, the altcoin price could rally higher to tag the 200-days EMA at $12.13 or higher to the $12.56 resistance level. Such a move would mean a 45% increase from current levels.
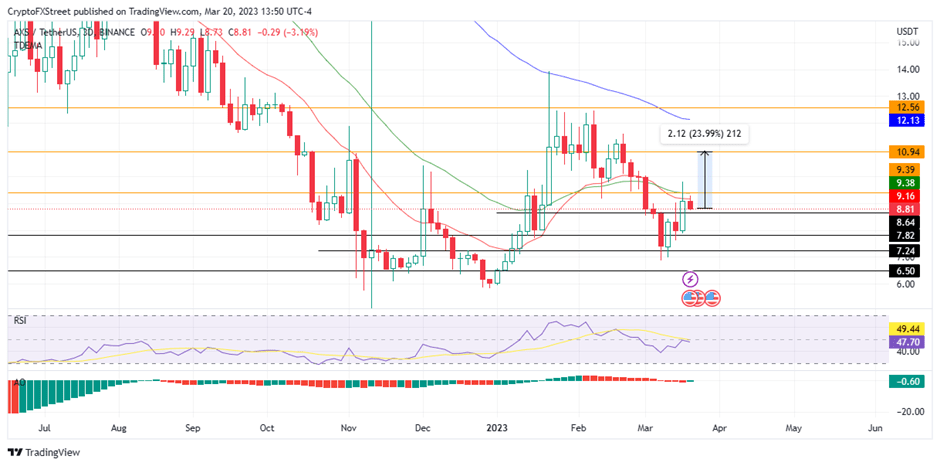 AXS/USDT 1-day chart
On the other hand, the general pressure from the 50-day EMA and the barrier cross at $9.37 could suppress the altcoin price and cause it to drop below the close support of $8.64. A close daily candlestick below this level could invalidate the bullish argument. A break below this immediate support could inspire more selling among AXS holders and cause AXS price to drop to the $7.82 support level or revisit the March 8 – March 11 lows around $7.24. In extreme cases, AXS price may delay further to test the $6.50 support base before attempting another uptrend.
APE traders will soon profit from Bitcoin rides
Analyst Filip L predicts a bull run for APE. Apecoin bulls are looking for these bargains because price action is still subdued after a definitive rejection at the weekend’s top. The rejection came as the bulls burned their fingers on the 200-day Simple Moving Average (SMA) for the fifth time in a row. Even though the weakening extends below $4.40, some buying remains.
APE may soon see the Bitcoin rally turn into a positive turn for price action. With the tailwinds kicking in, APE traders can move forward in this Bitcoin rally and enjoy profits greater than APE’s potential. When Apecoin price breaks the 200-day SMA at $4.60, the next level of profit is quoted at the 55-day SMA at $5.20.
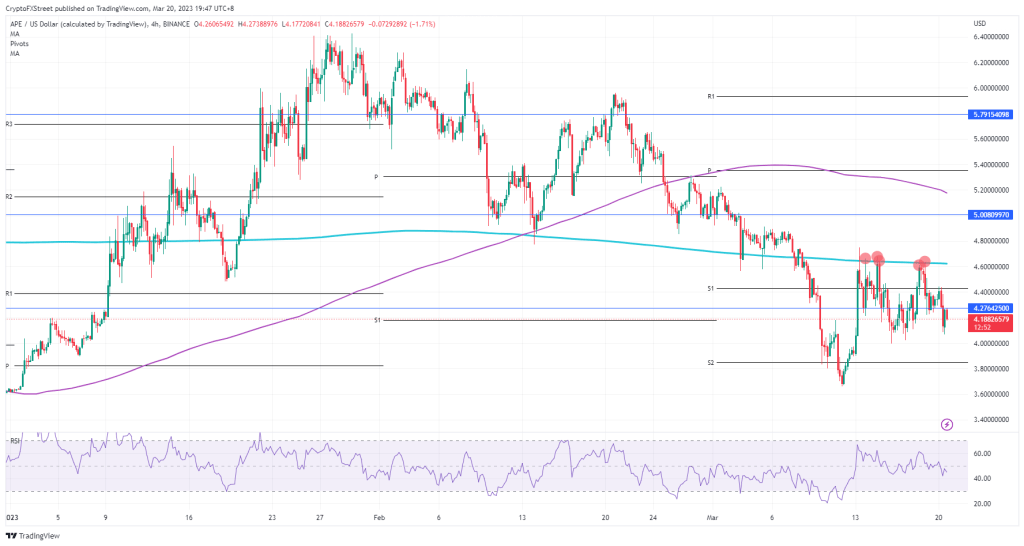 APE 4-hour chart
One element advocating further declines is that the RSI is still nowhere near any level to bounce back. With ample room to slide lower, the price of APE can drop as much as 10% to 15% before the oversold area is reached. If flipped to the Apecoin chart, this means that APE will be trading around $3.80.
This altcoin is on the rise
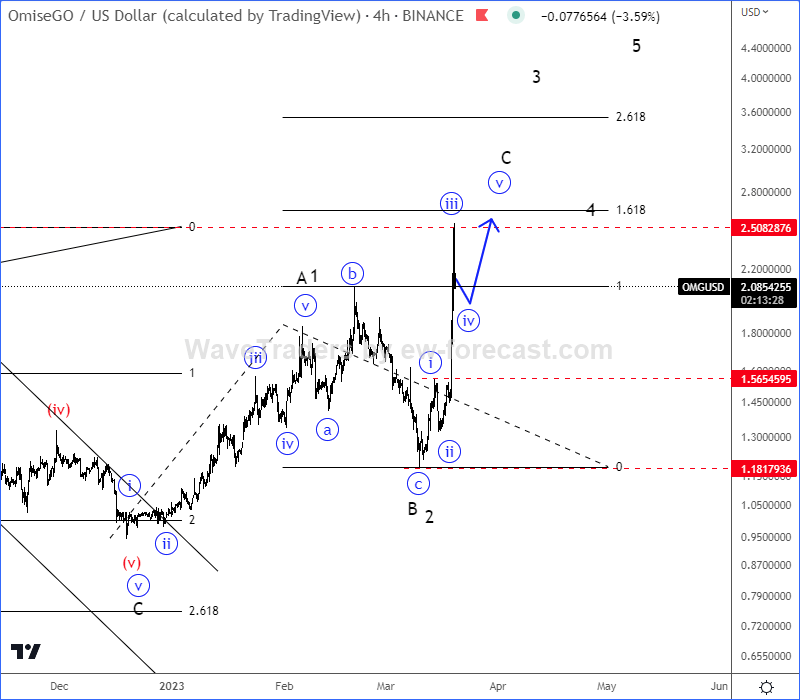
Analyst Gregor Horvat looks at the drawing of OmiseGO and explains: OmiseGO is already burning after seeing strong support around the 1.0 area on the daily chart on December 8, 2022. Well, after noticing five waves abc retracement towards wave A/1 on the 4-hour chart, followed by a three-wave abc retracement in wave B/2, we are now watching wave C or wave 3 and there is room for at least 2.5. Area 3.0 for wave C or maybe even higher for wave 3 of a five-wave bullish impulse if price goes towards area 4.
