
Ethereum found support near $2,830 and retraced some of its losses. According to technical analysis by NewsBTC’s Aayush Jindal, ETH could continue to rise if it stays above the 100 hourly SMA.
Ethereum Aims to Break Up Upward
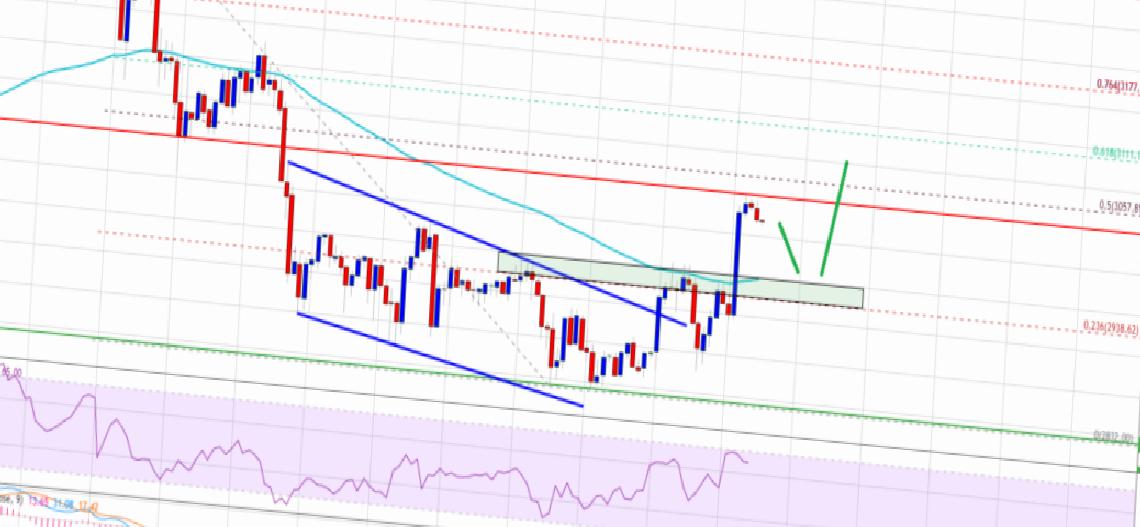
Ethereum found support near $2,830 and started a fresh increase after starting a downside correction below the $3,000 support zone. ETH climbed above the $2,900 and $2,920 resistance levels. There was a move above the 23.6% Fib retracement level of the low from the $3,283 low to $2,832 low. Besides, there was a break above a major bearish channel with resistance near $2,920 on the hourly chart of ETH/USD.
An immediate resistance is near the $3,040 level. The first major resistance is near the $3,060 level. This coincides with the 50% Fib retracement level of the key decline from the $3,283 low to $2,832 high. A successful close above $3,060 could initiate another rise. In the stated case, it could surpass the $3,100 and $3,110 levels. Any further gains could send the price towards the $3,250 level. An intermediate resistance is near the $3,200 level.
Will Ethereum Drop?
Jindal says that if Ethereum fails to start a fresh increase above $3,050 or $3,060, it could start a fresh decline. An initial support on the downside is near the $2,980 level. The next major support is near the $2,960 level and the 100 hourly simple moving average. A downside break below the $2,960 level could push the price towards the $2,920 level. The next major support is near the $2,850 level, below which there is a risk of a larger decline. In the stated case, the price could test $2,680.
What Do Technical Indicators Say?
- Hourly MACD – The MACD for ETH/USD is losing momentum in the bullish zone.
- Hourly RSI – The RSI for ETH/USD is now above the 50 level.
- Major Support Level – $2,960
- Major Resistance Level – $3,060


