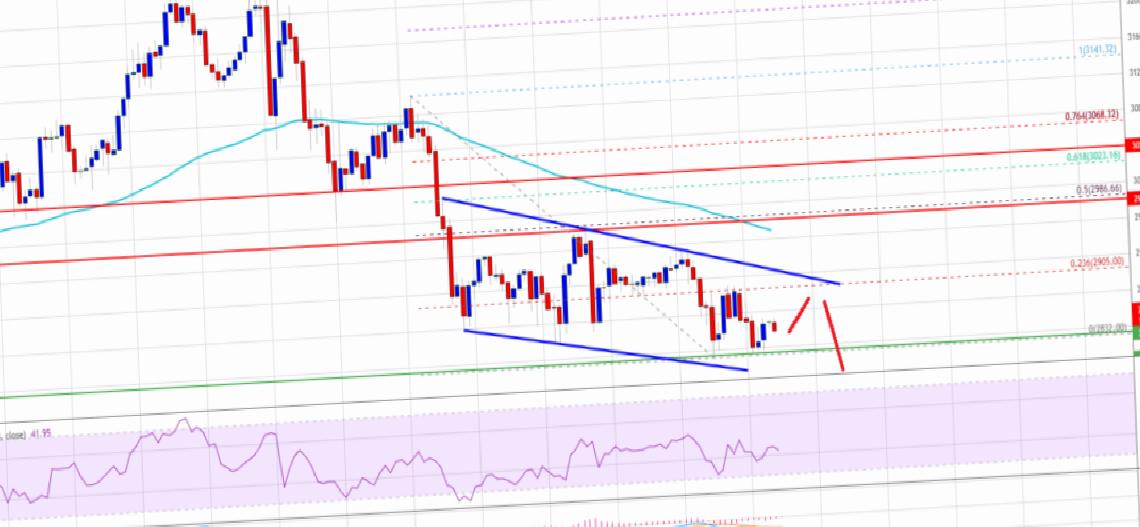
Ethereum settled below the $3,000 support zone. According to technical analysis by NewsBTC’s Aayush Jindal, it could continue to decline if it stays below the $3,000 pivot level.
Ethereum is at Risk
Ethereum declined as low as $2,832 after failing to stay above the $3,020 and $3,000 support levels. An immediate resistance for ETH, which is now consolidating its losses, is near the $2,880 level. The first major resistance is near the $2,950 level. There is also a key bearish channel forming with resistance near $2,900 on the hourly chart of ETH/USD. The channel resistance is near the 23.6% Fib retracement level of the recent decline from the $3,141 low to $2,832 low.

The main resistance is near the $3,000 level and the 100 hourly simple moving average. This coincides with the 50% Fib retracement level of the drop from the $3,141 low to $2,832 low. A successful close above $3,000 could start another uptrend. In the indicated case, the price could surpass the $3,050 and $3,080 levels. Any further gains could send the price towards the $3,120 level.
Will Ethereum Drop More?
Jindal says that if Ethereum fails to start a fresh increase above $2,900 or $3,000, it may continue to decline. An initial support on the downside is near the $2,830 level. The next major support is near the $2,800 level. A downside break below the $2,800 level could push the price towards the $2,720 level. The next major support is near the $2,650 level, below which there is a risk of a larger decline. In the stated case, the price could test $2,550.
What Do Technical Indicators Say?
- Hourly MACD – The MACD for ETH/USD is gaining momentum in the bearish zone.
- Hourly RSI – The RSI for ETH/USD is below the 50 level.
- Major Support Level – $2,800
- Major Resistance Level – $3,000