Bitcoin and altcoins are struggling to maintain the gains they made earlier this week. This is a potential sign that the price breakout is a response to Grayscale’s victory against the SEC. Can bulls defend support levels in altcoins like Bitcoin and DOGE? Will this lead to a stronger recovery soon? Crypto analyst Rakesh Upadhyay examines the charts of the top 10 cryptocurrencies to find out.
An overview of the crypto market
Bitcoin led crypto markets higher on August 29 after Grayscale won its lawsuit against the SEC. However, the rally could not be sustained as analysts warned that victory did not guarantee approval of the spot Bitcoin ETF. Still, it’s possible that victory could mean bullishness for Grayscale. Grayscale Bitcoin Trust (GBTC) will likely make a premium next year, Glassnode analysts say in an X post on August 30. As you follow on Kriptokoin.com, GBTC has been trading at a discount compared to the spot Bitcoin price for two and a half years.
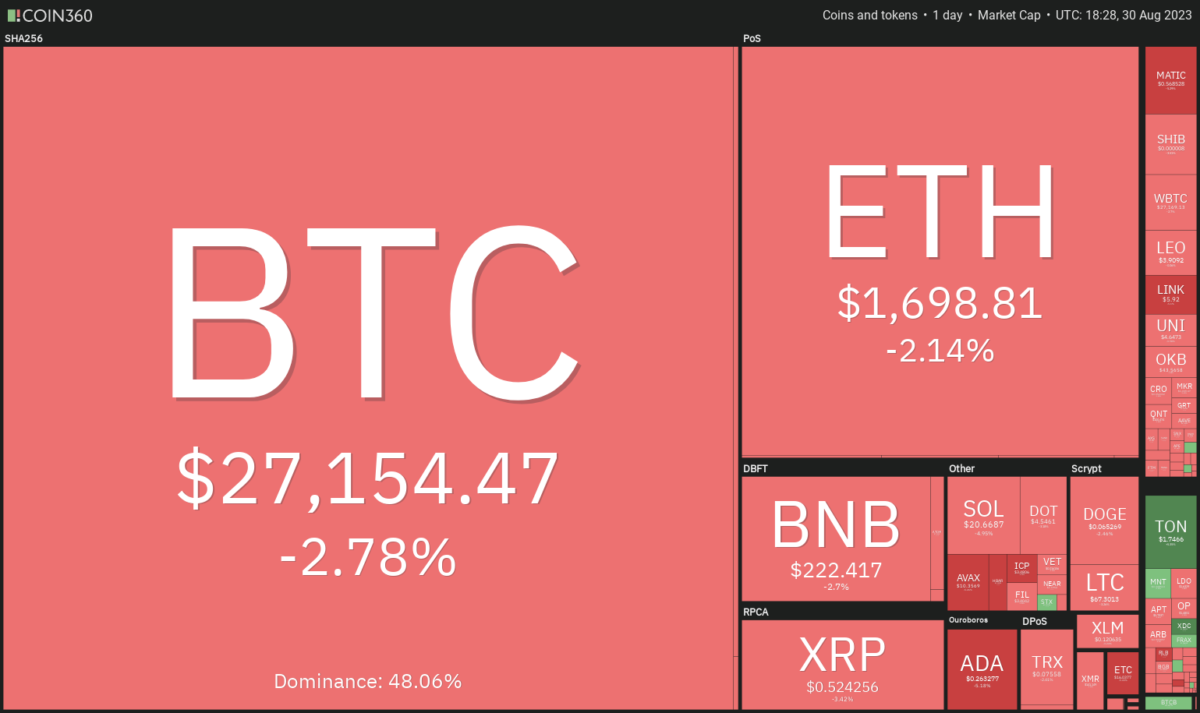 Daily cryptocurrency market performance. Source: Coin360
In the short-term, crypto markets are unable to sustain higher levels, although the S&P 500 Index is on the way to recovery and the US Dollar Index is bearish in the near-term. This shows that investors continue to focus on crypto-specific news.
BTC, ETH, BNB, XRP and ADA analysis
Bitcoin (BTC) price analysis
Bitcoin’s range resolved to the upside with a sharp breakout on August 29. This move suggests that the price will oscillate in the wide range between $24,800 and $31,000 for a few days.
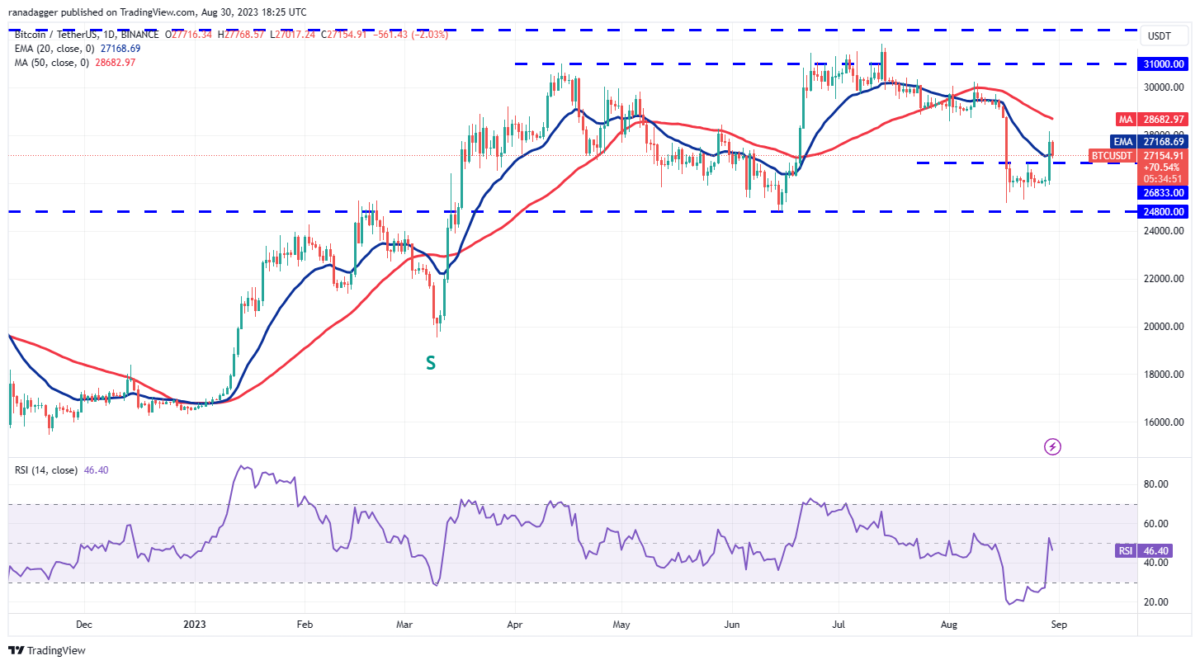
The 20-day exponential moving average (EMA) at $27,168 is flattening. Additionally, the relative strength index (RSI) is just below the midpoint. This shows that the selling pressure has decreased. Buyers will try to defend the breakout level of $26,833. If they are successful, this will signal that the bulls have turned the level into support. It is possible for BTC to rise first to the 50-day simple moving average (SMA) at $28,689. Then, a rally attempt to $31,000 is possible. If the bears want to trap the aggressive bulls, they will need to sink the price below $26,833. If they do this, it will show that the bears are selling with every rescue attempt. It is possible for BTC to retest strong support at $24,800 later.
Ethereum (ETH) price analysis
Ether once again recovered from the crucial support at $1,626 on August 28. This showed that the bulls were buying the lows.
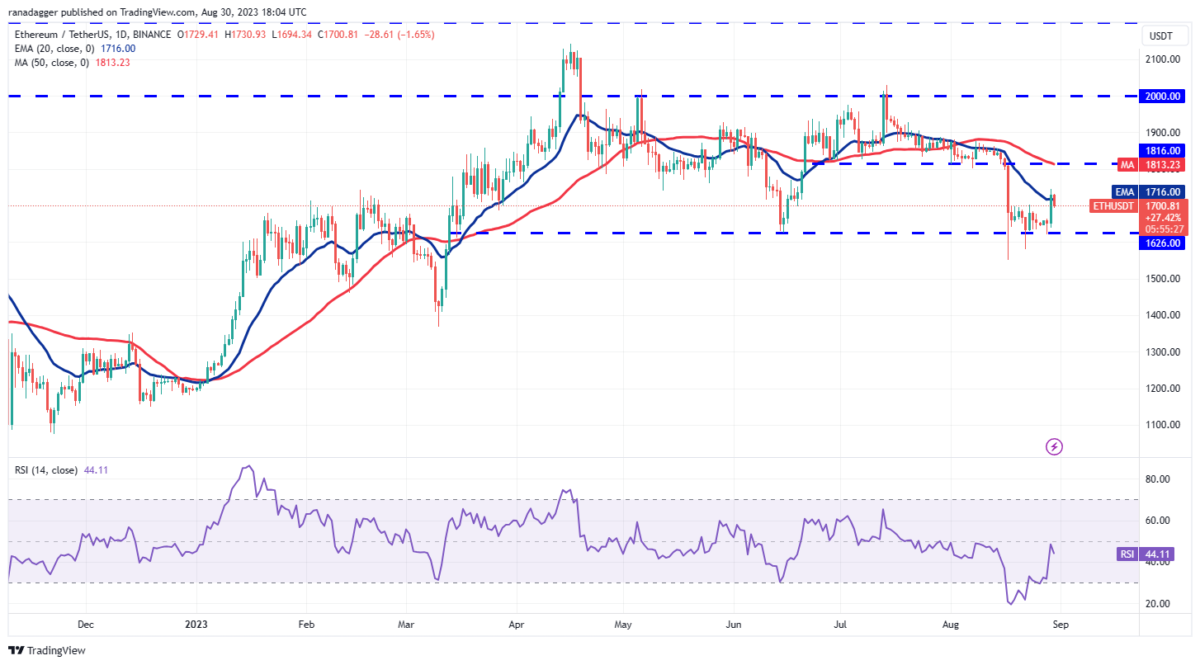
Momentum recovered on August 29 and the bulls pushed the price above the 20-day EMA ($1,716). This indicates that ETH may oscillate between $1,626 and $1,816 for a while. The price bounced back below the 20-day EMA on August 30. Thus, it signaled that the bears were not giving up yet. If the price stays below the 20-day EMA, a drop as low as $1,626 is possible. On the contrary, if the price rises and rises above the 20-day EMA, ETH is likely to reach the overhead resistance of $1,816.
Binance Coin (BNB) price analysis
After trading in a tight range around $220 for several days, BNB started to rise on August 29. The relief rally is facing resistance at the 50-day SMA ($235), as seen from the long wick on the day’s candlestick.
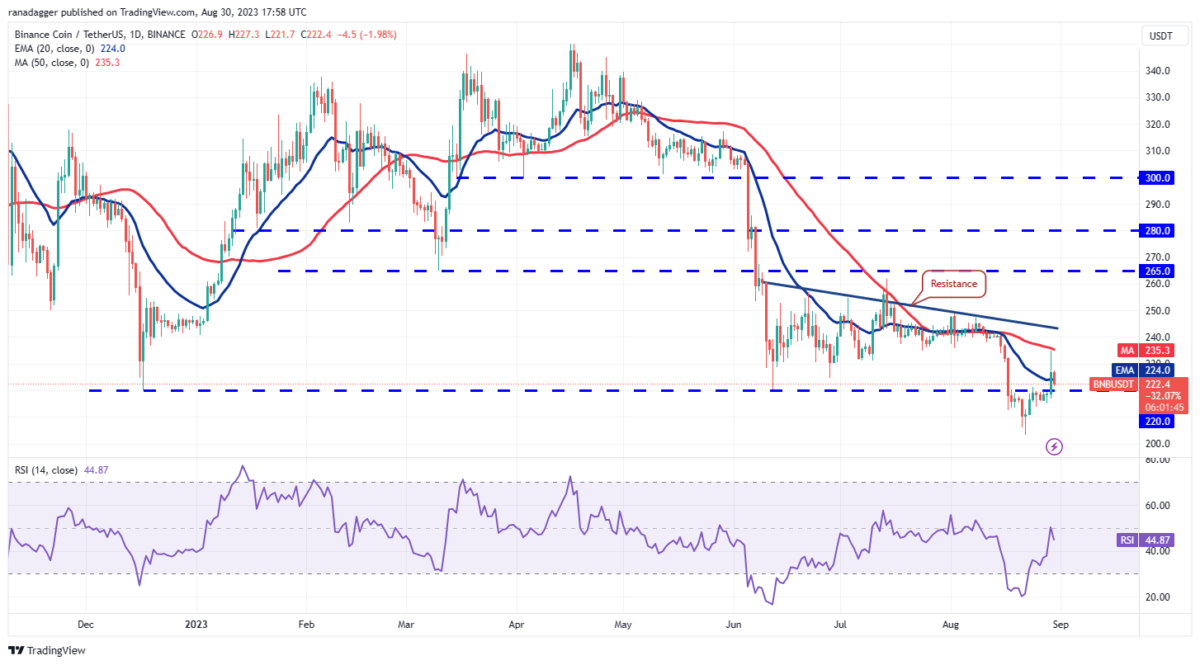
The 20-day EMA ($224) is flattening and the RSI is just below the midpoint. This shows that the downward selling pressure is decreasing. If the price turns up from the current level, it is possible for BNB to rise to the resistance line. This level is likely to attract the aggressive selling of the bears again. On the downside, if the price drops below $220, it will indicate that the bears are in control. In this case, BNB is likely to drop back to its intraday low of $203 on August 22.
Ripple (XRP) price analysis
XRP has been trading between $0.50 and $0.56 for the last few days. This indicates that the bulls are buying near support and the bears are selling near resistance.
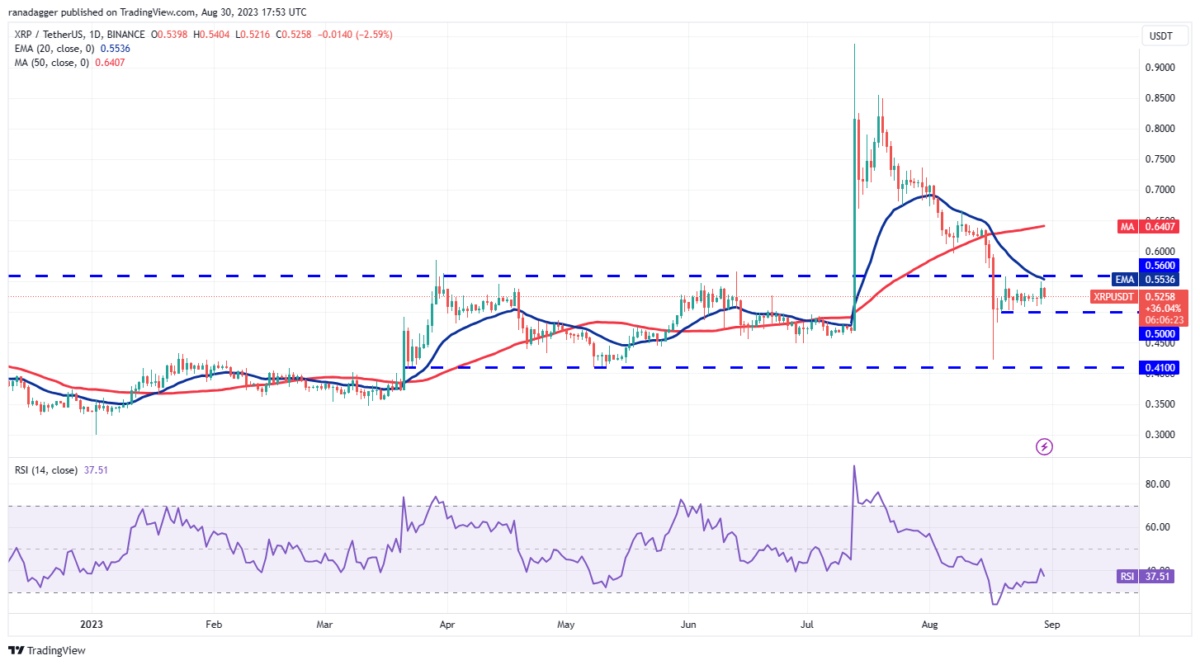
The falling 20-day EMA ($0.55) and the RSI in the negative zone show that the bears have the upper hand. Sellers will try to push the price below the strong support at $0.50. If they manage to do this, it is possible that XRP could drop as low as $0.41. Alternatively, if the price recovers from $0.50, it could extend XRP’s stay in the tight range for some more time. Buyers will need to push and sustain the price above $0.56 to signal the start of a sustained recovery. It is possible for XRP to rise to the 50-day SMA ($0.64) later.
Cardano (ADA) price analysis
The bulls took Cardano above $0.28 on August 29. However, they were unable to sustain higher levels. This kept the price below the $0.28 resistance.
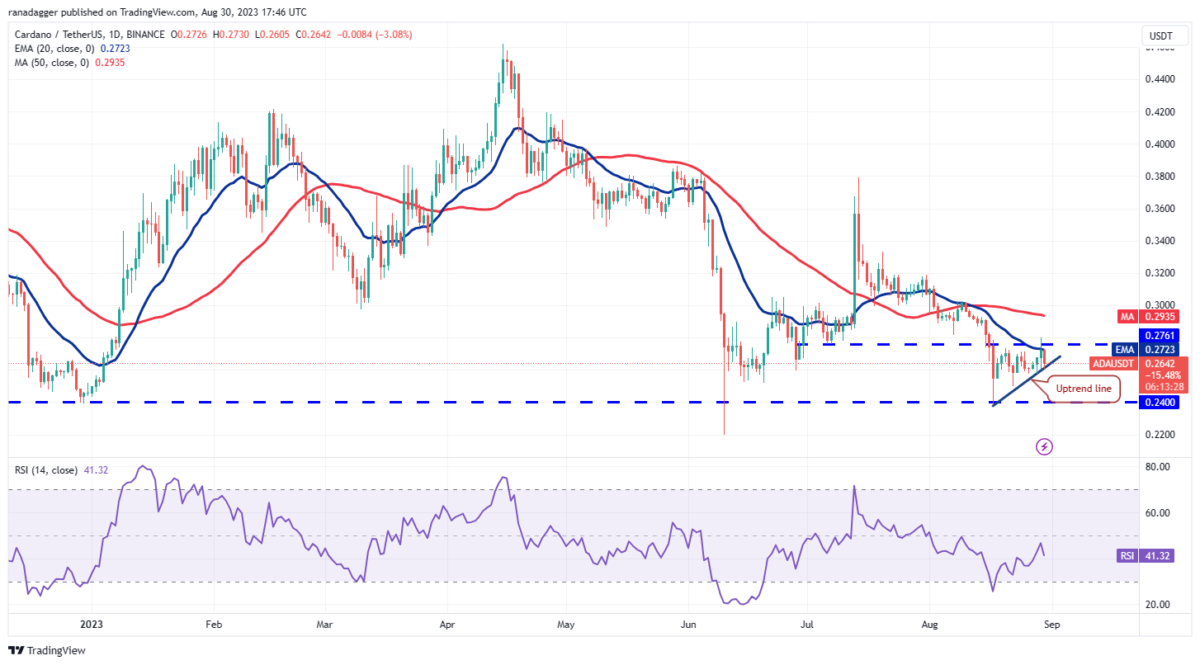
This indicates that the price is stuck in the range between $0.24 and $0.28. The next support is at the bullish trend line. If the price rebounds strongly from this level, it will indicate that every minor decline has been bought. This will increase the chances of a rally above $0.28. Above this level, ADA is likely to rise as high as $0.32. Instead, if the price breaks below the uptrend line, it will signal that the bears are trying to make a comeback. It is possible that ADA may slide to the vital support at $0.24 later.
DOGE, SOL, TONE, DOT and MATIC analysis
Dogecoin (DOGE) price analysis
DOGE price reached the 20-day EMA ($0.07) on August 29. However, the bulls are having a hard time keeping the DOGE price above it.
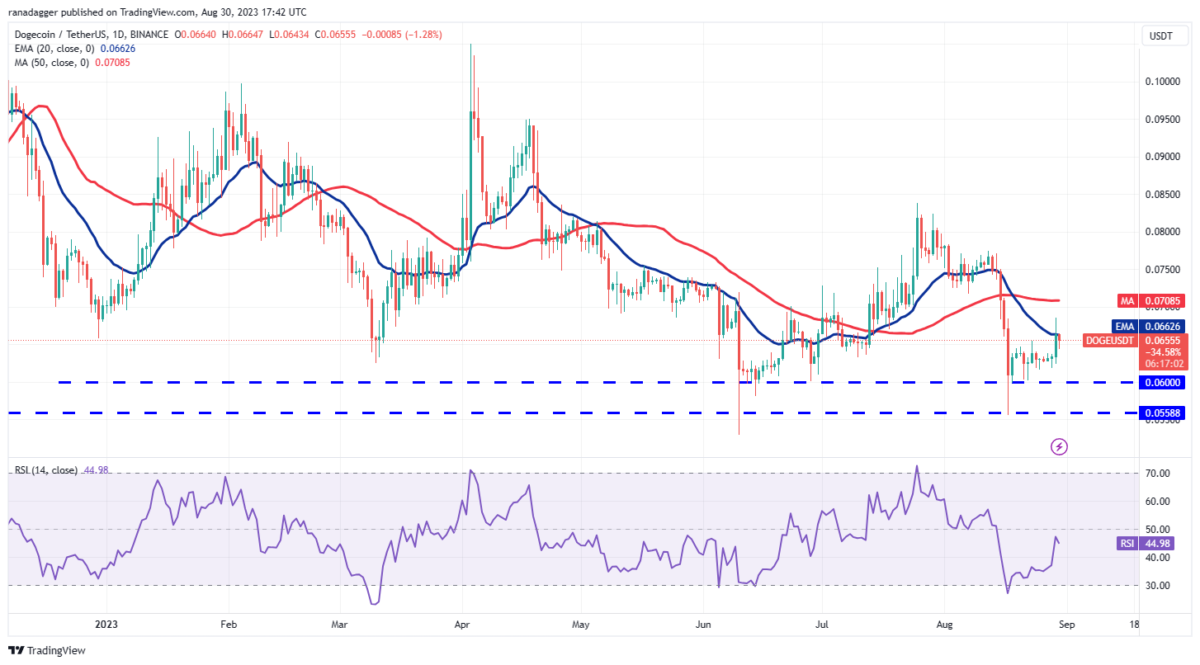
If DOGE price drops sharply from the current level, it will indicate that the bears are selling in rallies. It is possible for DOGE price to consolidate between the 20-day EMA and the $0.06 support later. Alternatively, if DOGE fails to leave much ground above the current level, it will indicate that the bulls are maintaining the buying pressure. This is also likely to open the doors for a potential rally to $0.08.
Solana (SOL) price analysis
Solana’s recovery hit a roadblock at the 20-day EMA ($21.77) on August 29. This suggests that sentiment remains negative and traders are selling on rallies.
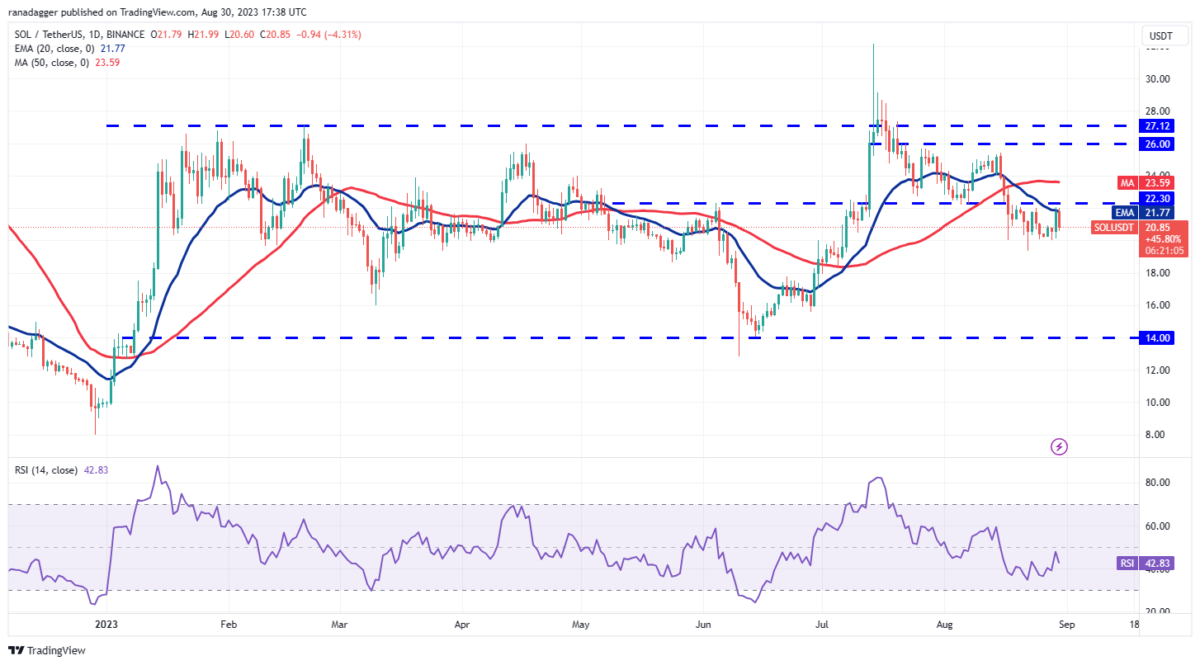
The bears will once again try to push the price to $19.35. If this level is broken, SOL could start a downside move towards $18 and then $16. The bulls are likely to have other plans. They will try to build on the recovery by pushing the price above the overhead resistance of $22.30. If they manage to do so, it is possible for the SOL to rise to the 50-day SMA ($23.59). If the price turns down from this level, the SOL is likely to remain range-bound between the 50-day SMA and $19.35 for a while.
Toncoin (TON) price analysis
Toncoin (TON) broke above the neckline of the inverted head and shoulders formation at $1.53 on August 29. This indicates a potential trend change.
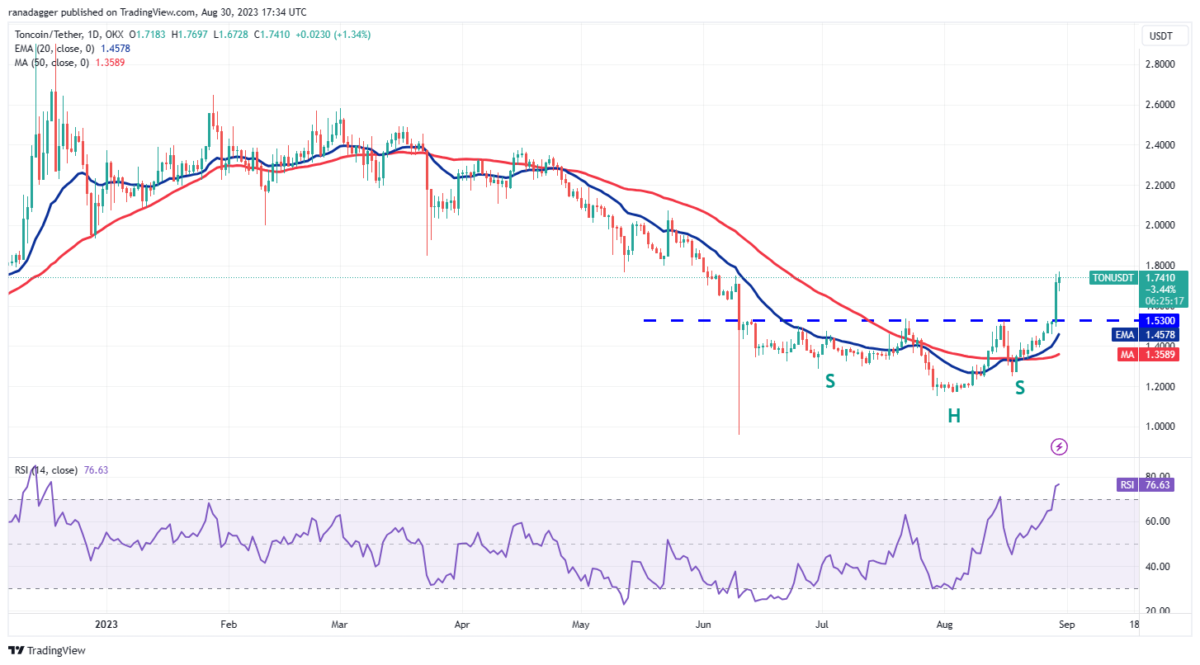
Typically, after a breakout, the price drops and retests the breakout level. If the price bounces off $1.53, it will indicate that the bulls have turned this level into support. It is also possible that this could start a bullish move towards the formation target of $1.91. If it breaks this resistance, it is possible for the TON to reach $2.07. If the bears want to avoid the rally, they will need to quickly drop the price below $1.53. Such a move could trap aggressive bulls and result in a long liquidation. It is possible that TON will drop to $1.25 later.
Polkadot (DOT) price analysis
Polkadot broke and closed above the 20-day EMA ($4.64) on August 29. However, the long wick on the candlestick indicates selling at higher levels.
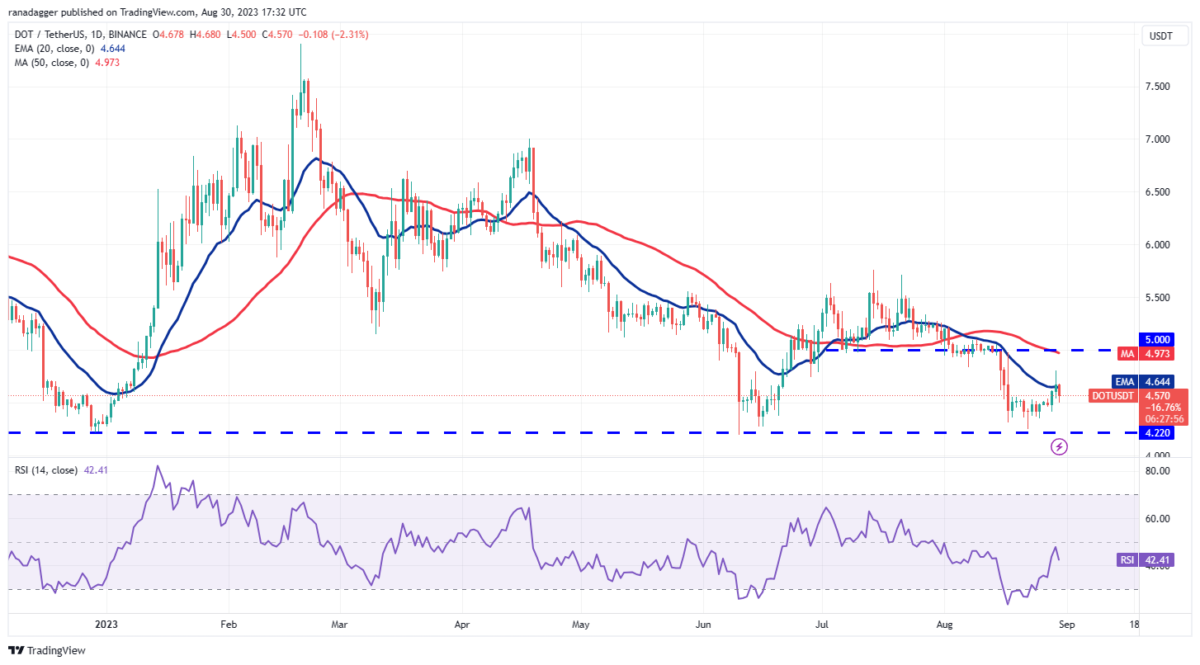
The bears pulled the price back below the 20-day EMA on August 30. This shows that the bears are not giving up and see the rebounds as a selling opportunity. The flattening 20-day EMA and the RSI in the negative zone are signaling possible range-bound move in the near term. If the price drops below $4.50, the DOT could oscillate between the 20-day EMA and $4.22 for a while. On the other hand, a break and close above the 20-day EMA could push the DOT towards the overhead resistance of $5.
Polygon (MATIC) price analysis
MATIC is facing stiff resistance in the region between $0.60 and $0.65, as seen from the long wick on the August 29 candlestick.
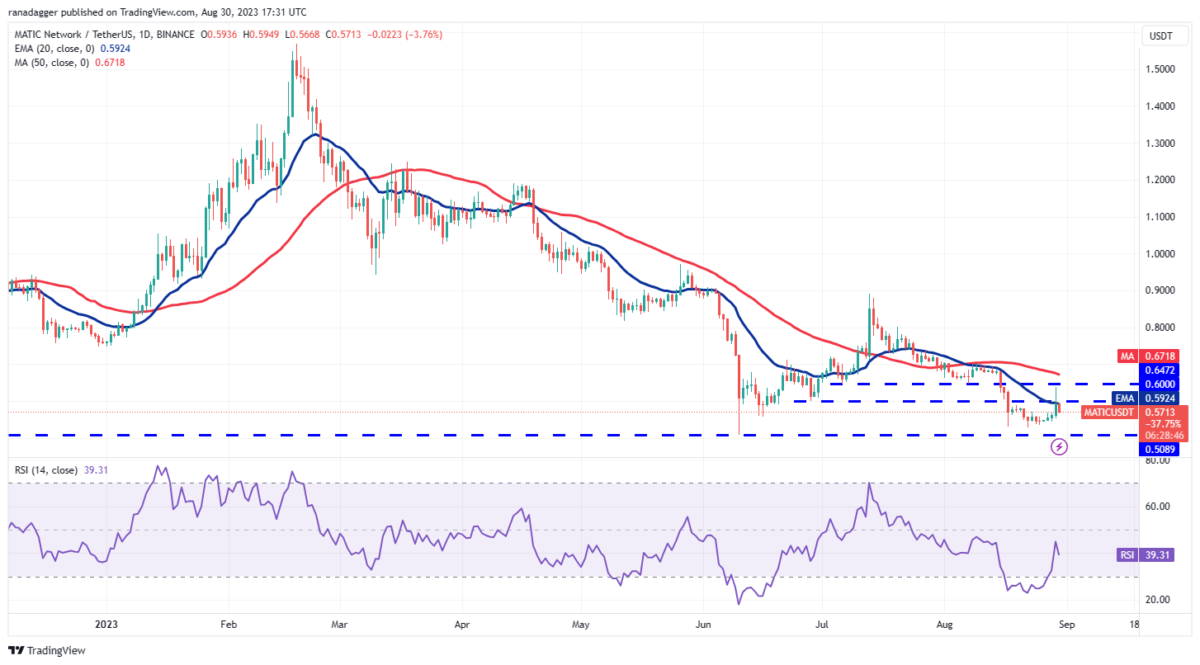
The fact that the price dropped on August 30 indicates that MATIC will consolidate in a wide range, possibly between $0.51 and $0.65, for a while. Price action within the range is likely to remain random and volatile. If the bears want to take control, they will need to push the price below $0.51. This is also likely to continue the downtrend with the next support at $0.45. On the upside, a breakout and close above the 50-day SMA ($0.67) could signal that the bulls are in the driver’s seat.