Bitcoin and certain altcoins are struggling to break above the sudden resistance levels. As a result, sellers continue to evaluate the negative news chain that FTX started. Let’s take a look at what levels critical technical analysis breakdown for DOGE, MATIC, DOT, and BTC.
Sentiment in the cryptocurrency ecosystem remains fragile
In their new analysis, trading firm QCP Capital said that cryptocurrencies could continue to underperform into the new year. QCP predicts Bitcoin to drop to $12,000 and Ethereum to $800. On the bright side, FTX could be the last major player to bite the dust during the current bear market cycle, according to CK Zheng, co-founder of crypto hedge fund ZX Squared Capital.

Zheng also added that institutional investors with a long-term horizon can continue to invest in Blockchain technology and choose cryptocurrencies such as Bitcoin and Ethereum. When sentiment plummets, rumors create panic among investors who are selling their holdings out of fear. Usually, these situations create a bottom. So, what are the key levels to consider in the coming days, and which could indicate that the correction is over? To answer, let’s take a look at the technical analysis of analyst Rakesh Upadhyay.
Bitcoin, Ethereum, DOGE, XRP analysis
Bitcoin (BTC)
BTC continues to trade below the $17,622 breakout level, which is a negative sign. After a period of high volatility, the price is stuck in the $16,229 to $17,190 range.
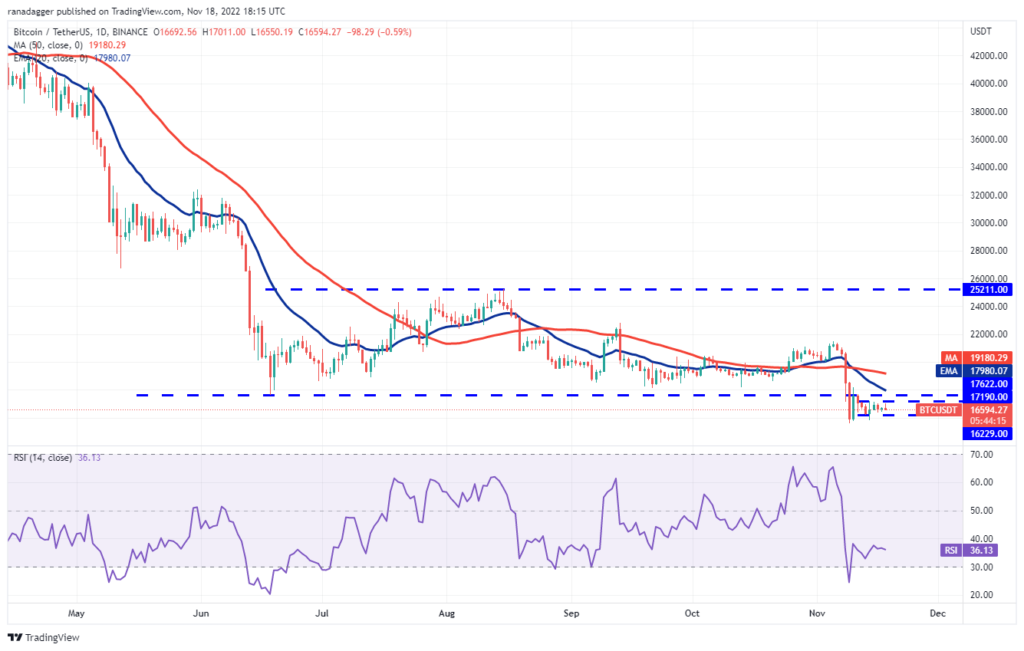
The 20-day EMA of $17,980 is tilting downwards. The RSI is in negative territory, showing bears in control. If the price dips below $16,229, BTC could retest the November 9 low of $15,588. A break below this support would trigger panic selling towards $12,200. Conversely, if buyers push the price above $17,190, this will indicate strong demand at the lower levels. BTC will then head towards the overhead resistance zone between $17,622 and the 20-day EMA. A close above this zone marks the start of a new upward move.
Ethereum (ETH)
Ethereum has been gradually losing ground over the past few days. The bears try to increase their advantage by pulling the price below the critical support of $1,171. If successful, ETH will head towards the support line of the descending channel formation.
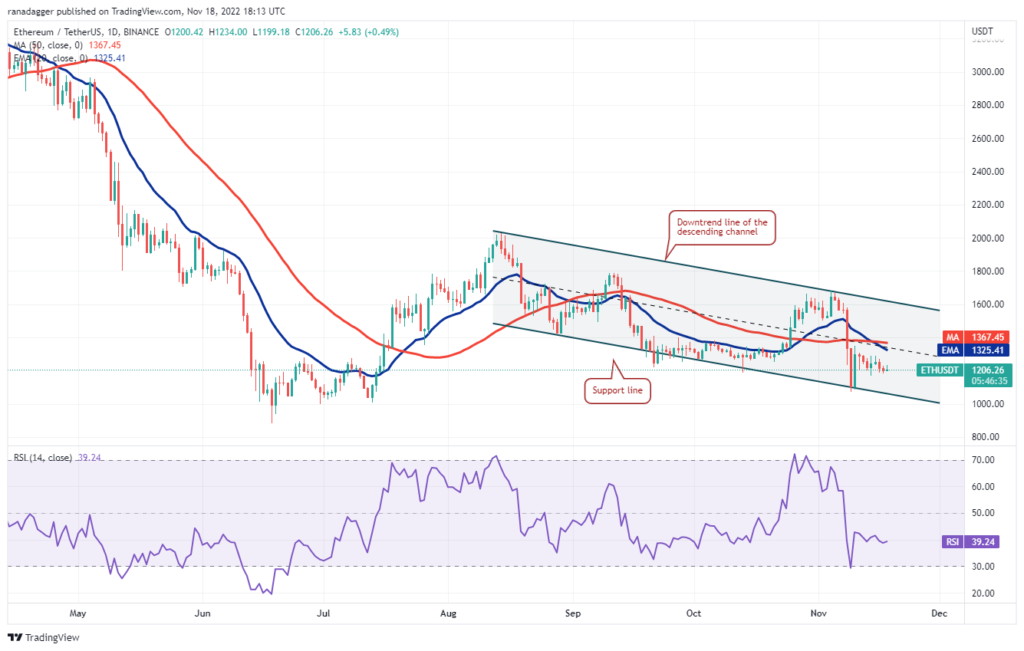
The 20-day EMA of $1,325 and the RSI in the negative zone suggest that the sellers have the upper hand. Selling will accelerate if the bears pull the price below the support line of the channel. ETH price will then head towards $1,000. The first sign of strength will be a breakout and close above the moving averages. Such a move opens the doors for a possible rally to the downtrend line. The bulls have to break through this hurdle to signal the start of a new upward move.
BNB Coin (BNB)
BNB once again approached the strong support at $258 on November 17. But the bulls held their ground. Buyers are now trying to start a relief rally that will reach the 20-day EMA of $291.
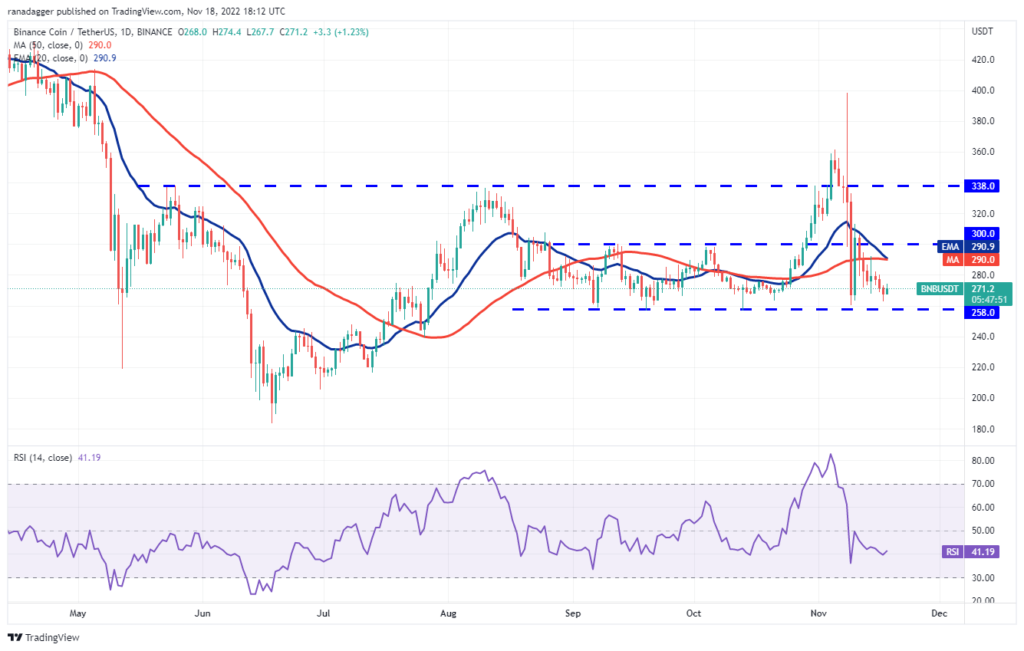
The downward sloping 20-day EMA and RSI in the negative zone suggest that the bears are in control. If the price breaks from the current level or the 20-day EMA, the bears will make another attempt to break the support at $258. If that happens, BNB price will head towards $239 and then $216. On the contrary, if the bulls push the price above the 20-day EMA, it will rise to the $300 zone. The bulls have to break through this hurdle to open the doors to a possible rally to $338.
XRP
XRP faces selling near the downtrend line. This indicates that the bears are trying to leverage their advantage and push the price below the critical support of $0.36.
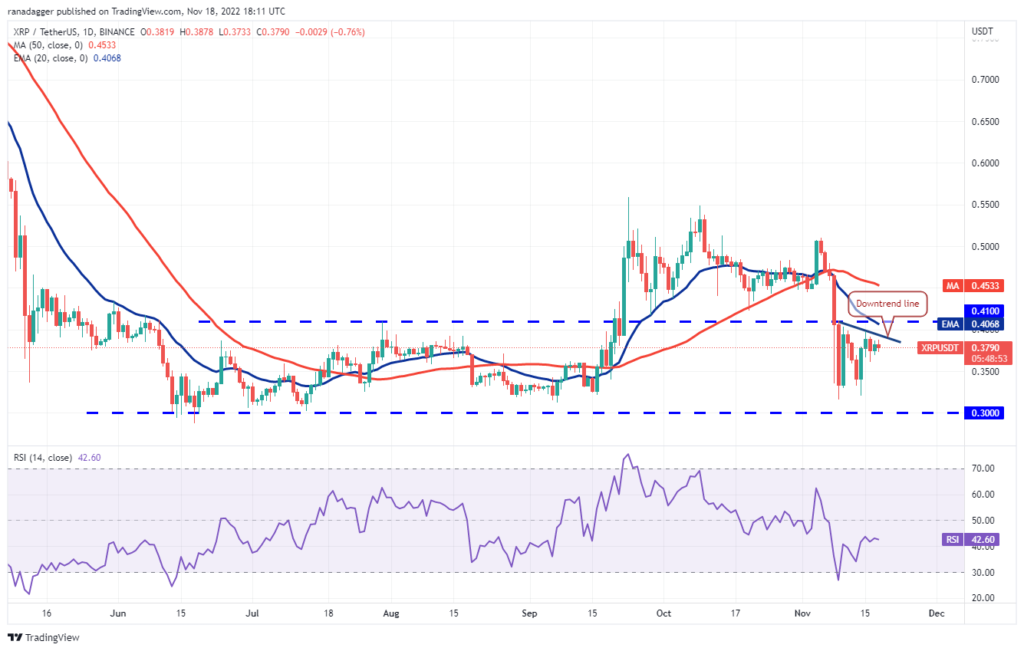
The 20-day EMA of $0.41 and the RSI in the negative zone indicate that the path of least resistance is to the downside. If the $0.36 level breaks down, XRP price will head towards $0.32. To invalidate this bearish view, buyers will need to overcome the tough fight in the area between the downtrend line and $0.41. If this happens, the pair will gain momentum and head towards the 50-day SMA at $0.45.
Cardano (ADA)
Cardano remains in a strong downtrend. The bears are attempting to push the price below the critical support of $0.31. But the bulls are likely to have other plans. They may try to aggressively defend this level.
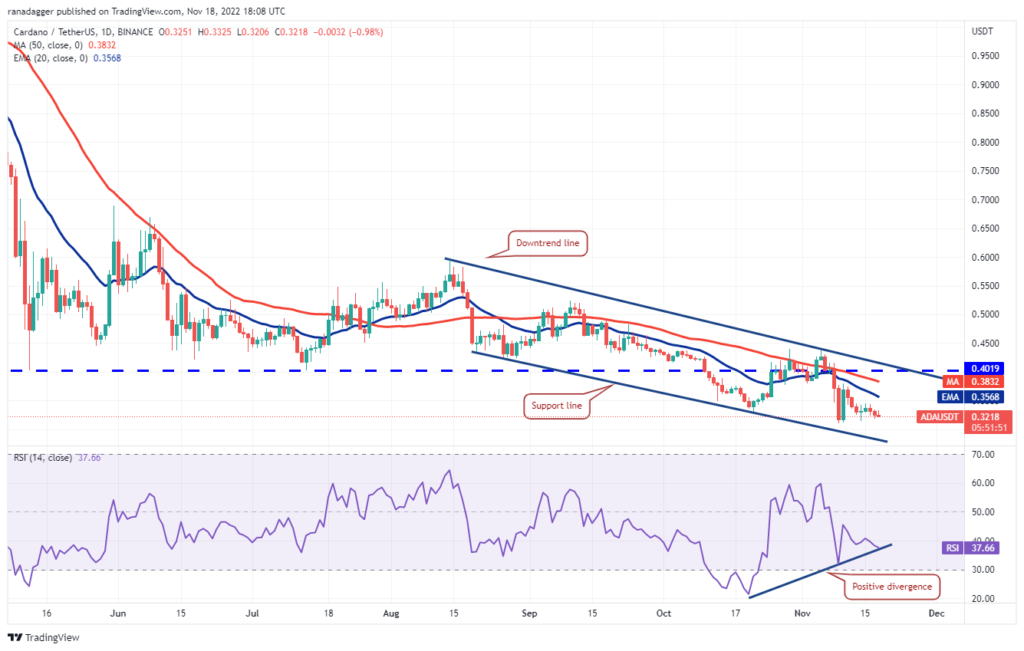
Any relief rally is likely to face stiff resistance in the region between the $0.35 and the 20-days EMA of $0.36. If the price turns down from this zone, the probability of a break below $0.31 increases. ADA will then head to the support line. This is an important level to follow. Because if it breaks, the next stop will be $0.25.
This negative view will be invalidated in the near term if buyers push the price above the 20-day EMA. ADA will then head to the downtrend line. A break and close above this resistance signals a potential trend reversal.
Dogecoin (DOGE)
Dogecoin (DOGE) has been trading between moving averages for the past few days. This indicates that the bulls are buying lows to the 50-day SMA at $0.08. It also indicates that the bears are selling rallies to the 20-day EMA ($0.09).
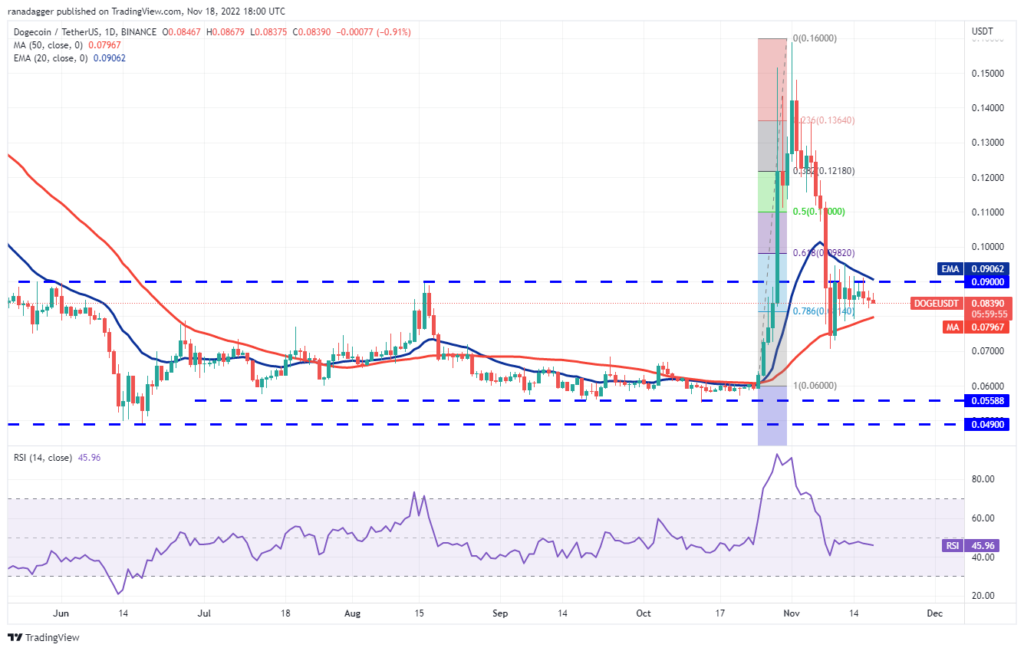
The downward sloping 20-day EMA and the RSI just below the midpoint point to a minor advantage for the bears. If the price drops and dips below the 50-day SMA, DOGE price will head towards $0.07 and then $0.06. The bulls will likely have other plans as they will try to push the price above the overhead resistance and sustain it at the 20-day EMA. If successful, DOGE will initiate a stronger recovery. DOGE bulls will then head towards $0.12.
Polygon (MATIC)
Polygon closed below the 50-day SMA ($0.89) on Nov. 17, after trading between moving averages for the past few days. Buyers tried to push the price above the 50-day SMA on November 18. However, he encountered fierce resistance from the bears.
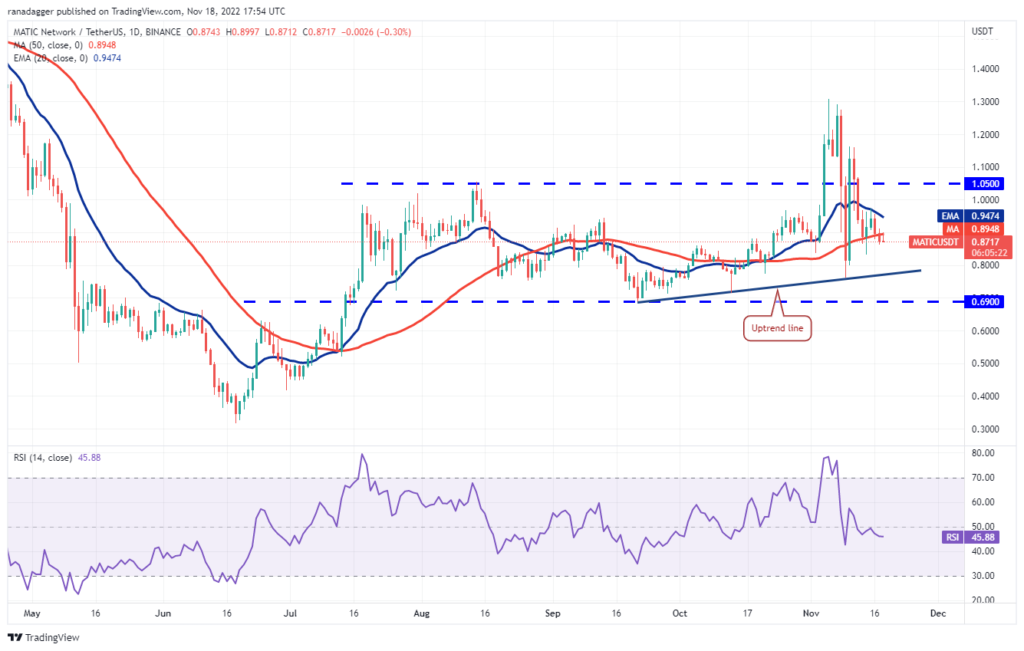
If buyers push the price above the 50-day SMA, MATIC price will head towards $0.95. The bears will probably have a strong defense at this level. However, if the bulls break this hurdle, the price will gain momentum to $1.05. Alternatively, if the price fails to break above the moving averages, it indicates that the sentiment remains negative and traders are selling in the rallies. This increases the probability of falling to the bullish line.
Polkadot (DOT)
The price action of the last few days has formed a pennant that often acts as a continuation pattern. The downward sloping moving averages and RSI in the negative zone suggest that sellers have the advantage on Polkadot.
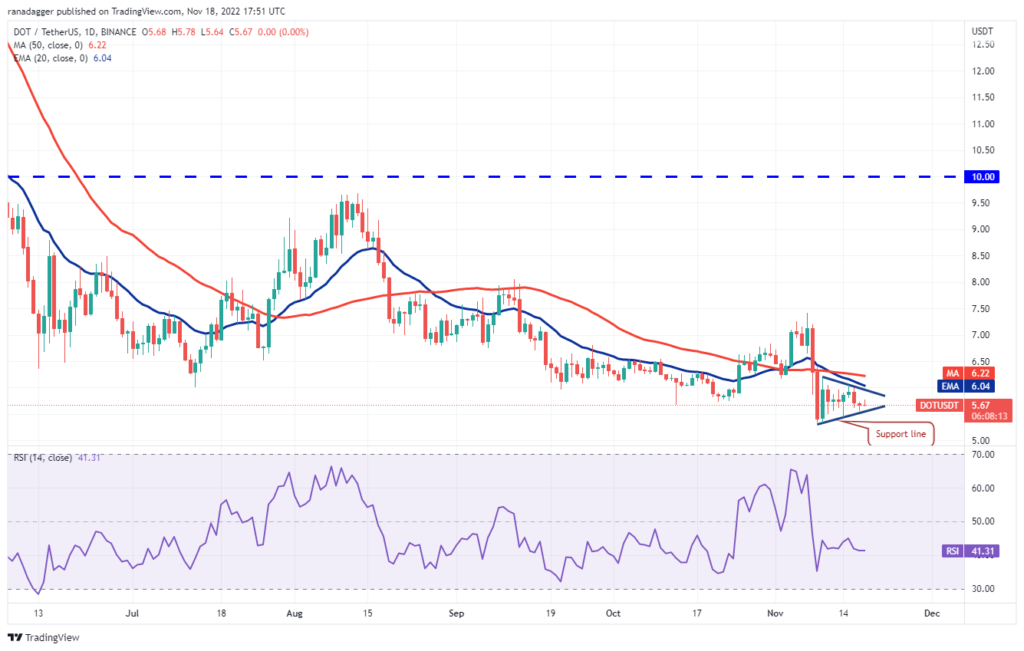
If the price drops and breaks below the pennant, selling will accelerate. DOT price will start the next leg of the downtrend with a break below $5.32. The next support on the downside is at $4.32. Conversely, if the price continues to rise and rises above the pennant, it will invalidate the downtrend. It will then head towards the 50-day SMA of $6.20. A break and close above this level will indicate that the short term pullback is coming to an end.
Uniswap (UNI)
Uniswap dropped to the 50-day SMA of $6.43 on Nov. 16. However, the bulls are attempting to form a higher low at $5.66.
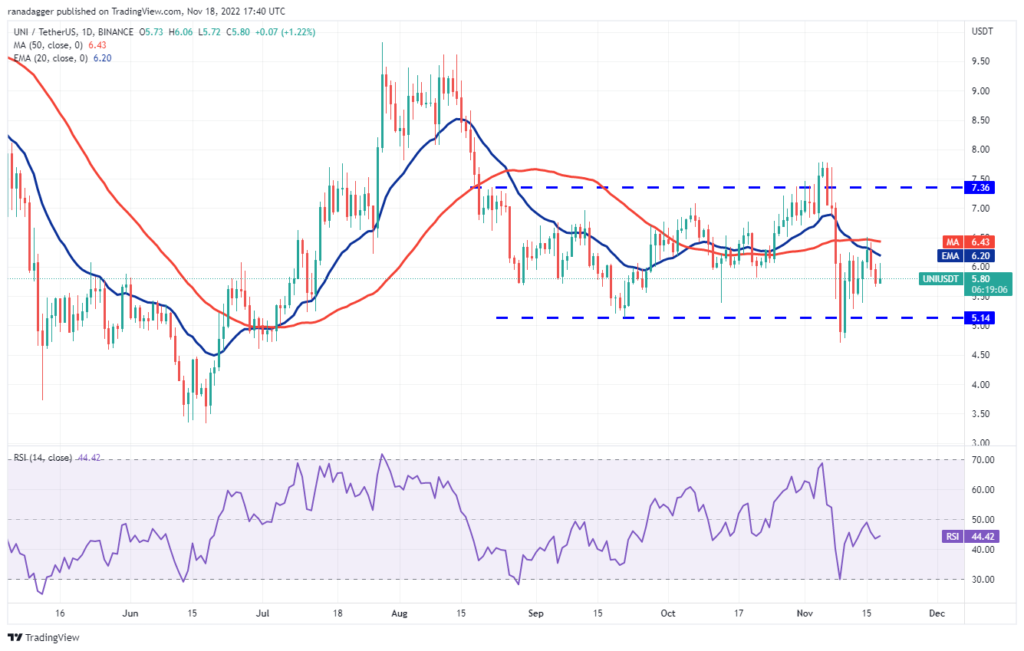
The bulls will have to push and sustain the price above the 50-day SMA to gain the upper hand. If this happens, UNI price will head towards $7.36 and then $7.79. The long wick on November 18 shows the bears defending the moving averages. The 20-day EMA of $6.20 and the RSI just below the midpoint suggest that the bears are taking advantage. A break and close below $5.66 will clear the way for a retest of $5.14.
Litecoin (LTC)
As you follow on Kriptokoin.com, Litecoin broke and closed above the 20-day EMA of $59 on November 17. Meanwhile, the RSI jumped into the positive territory, showing that the bulls have a slight advantage.

Now, the up move is likely to face stiff resistance at $65. If the price drops from this level, LTC price will again trend towards the moving averages. Contrary to this assumption, if buyers hold and sustain the price above $65, the bullish momentum will increase. It will then begin a recovery attempt towards the overhead resistance at $75. The bears must defend this level with all their might. If the price drops from $75, it will spend a few more days in the $46 to $75 range.