Bitcoin (BTC) and many altcoins are carving out bottom patterns as sentiment in crypto and equity markets continues to improve. Is it possible for buyers to bypass the general barrier in Bitcoin and selected altcoins? Crypto analyst Rakesh Upadhyay examines the charts of the top 10 cryptocurrencies to find out. We have prepared the analyst’s estimations and evaluations for our readers.
An overview of the cryptocurrency market
As you follow on Kriptokoin.com, Bitcoin (BTC) failed to break the $25,000 barrier on August 11, despite having two catalysts, a “positive” CPI data and news that BlackRock is launching a spot Bitcoin investment product.
In contrast, Ethereum (ETH) has managed to retain its recent gains in the news that the Goerli test-net has successfully enabled Proof-of-stake. This, in turn, cleared the way for Ethereum’s main-net transition scheduled for September 15 or 16. Santiment data shows that Ethereum whale transactions are increasing with possible whale accumulation.
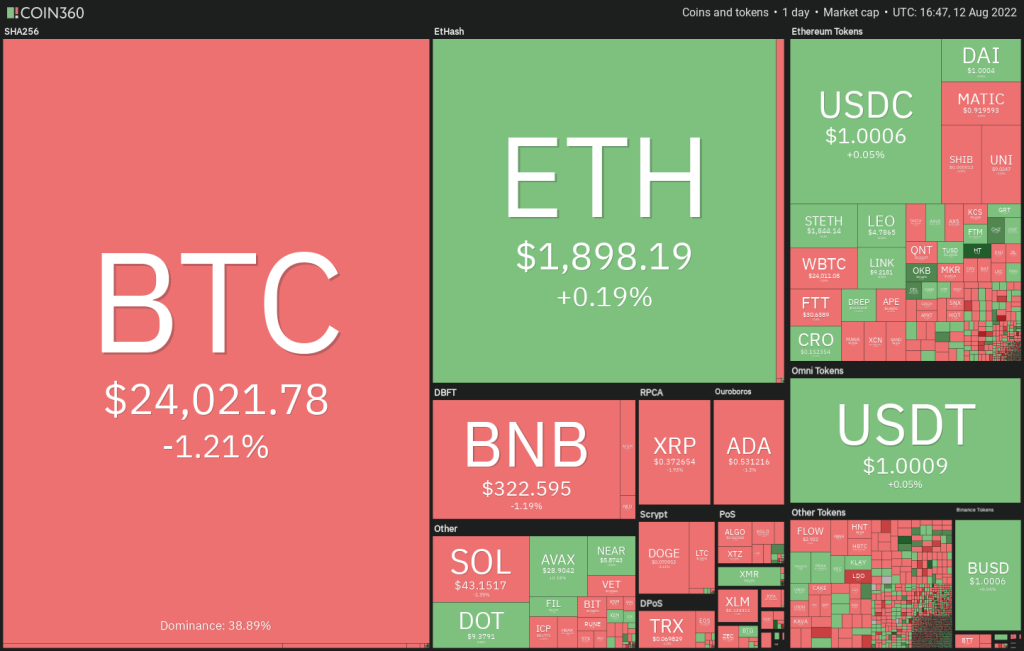 Daily cryptocurrency market performance / Source: Coin360
However, analysts are divided on prospects for the current recovery. Some say that the Bitcoin rally could rise above $28,000. Others are not that high. They expect the price to drop and the bear trend to continue. Now it’s time for analysis…
BTC, ETH, BNB, XRP and ADA analysis
Bitcoin (BTC)
BTC broke above the overhead resistance at $24,668 on Aug. However, the bulls failed to sustain higher levels. This shows that the bears have not given up yet and are selling on the rallies.
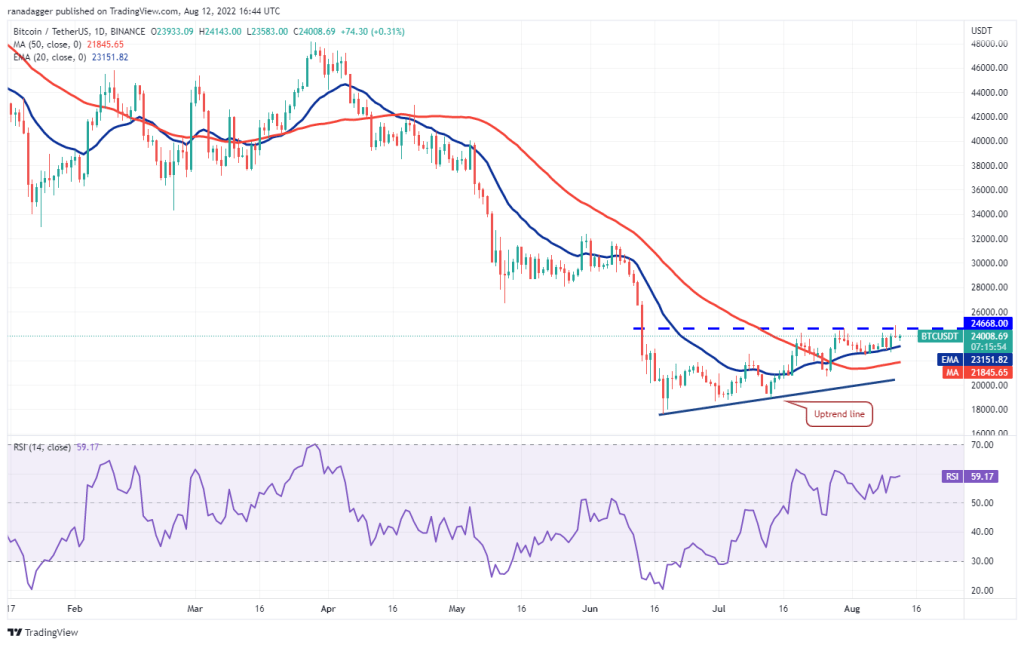
BTC price is stuck between the 20-day exponential moving average (EMA) ($23,151) and $24,668. Usually, a narrow range trade is followed by a range expansion. However, it is difficult to predict the exact direction of the breakout. In this case, the 20-day EMA is gradually rising and the relative strength index (RSI) is in the positive territory. This shows that the path of least resistance for BTC is upwards.
If buyers push the price above $25,000 and sustain it, further bullish momentum is possible. Such BTC could rally to $28,000 and then to $32,000. This positive sentiment is likely to be invalidated in the short term if the price drops and dips below the 20-day EMA. BTC could then drop to the 50-day simple moving average (SMA) ($21,845).
Ethereum (ETH)
ETH tried to break above $2,000 on August 11. However, the long wick on the candlestick of the day shows that the bears are vigorously defending the level.
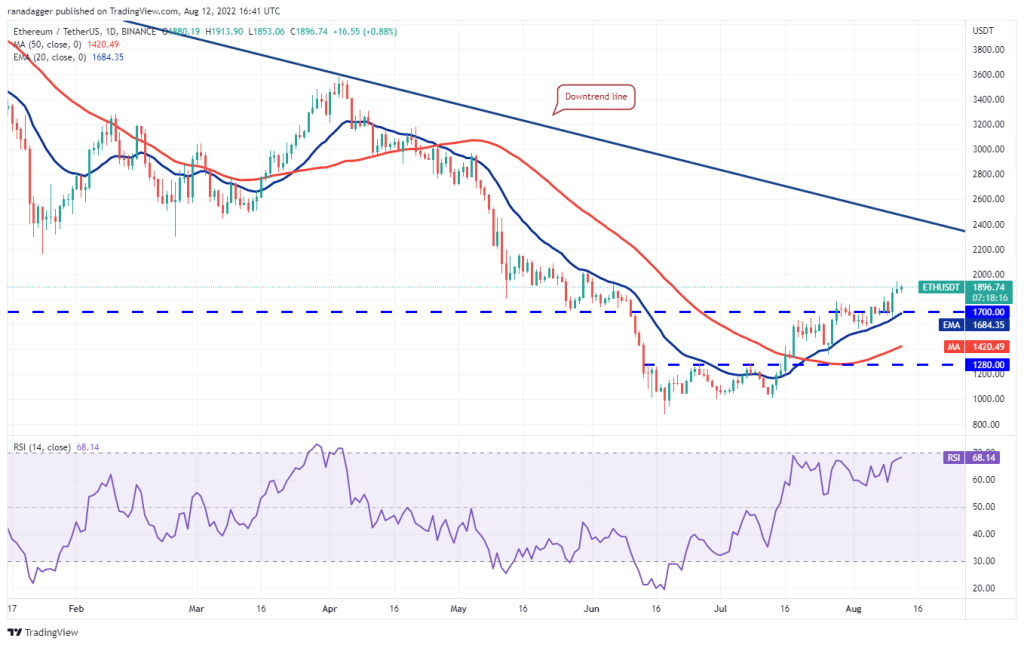
However, a positive sign is that the bulls have not left the ground for the bears. This shows that traders are not in a hurry to take profits as they think the upward movement will continue. The ascending moving averages and the RSI near the overbought zone are giving buyers an advantage. If the bulls push the price above $2,000, a rise to the downtrend line is possible. Alternatively, if the price drops sharply from the current level, the bears will try to push ETH down to the $1,700 breakout level. The bulls are expected to buy the dip to this support.
Binance Coin (BNB)
BNB is facing stiff resistance in the overhead resistance zone between $338 and $350. While the bears have repeatedly thwarted the bulls’ attempts to break through this hurdle, the buyers haven’t given up much. This shows that the bulls are not in a rush to exit as they expect a higher move.
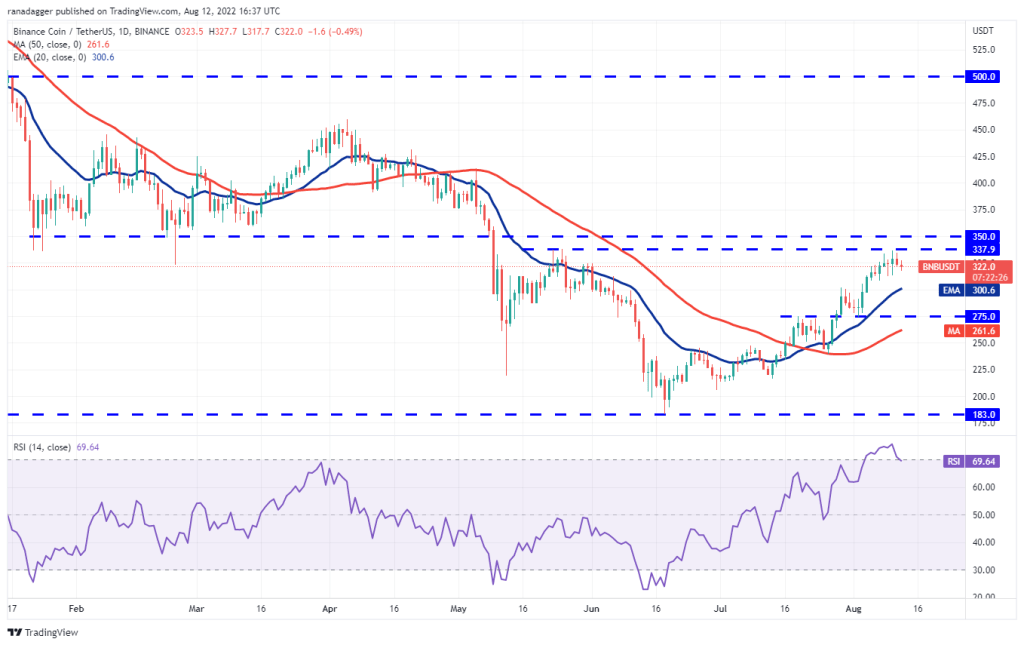
A tight consolidation near the top resistance increases the likelihood of a breakout above it. If this happens, it is possible for BNB to try to climb higher to $380 and then to $414. Important support to watch out for on the downside is the 20-day EMA ($300). If the bears sink the price below this level, BNB is likely to drop to $275 and then to the 50-day SMA ($261). A break below this support is likely to turn the advantage in favor of the bears.
Ripple (XRP)
XRP is stuck between the overhead resistance of $0.39 and the 20-day EMA ($0.37). The Bears tried to resolve this uncertainty to their advantage on August 9 and 10. However, the bulls bought the dip. It then pushed the price above the 20-day EMA.
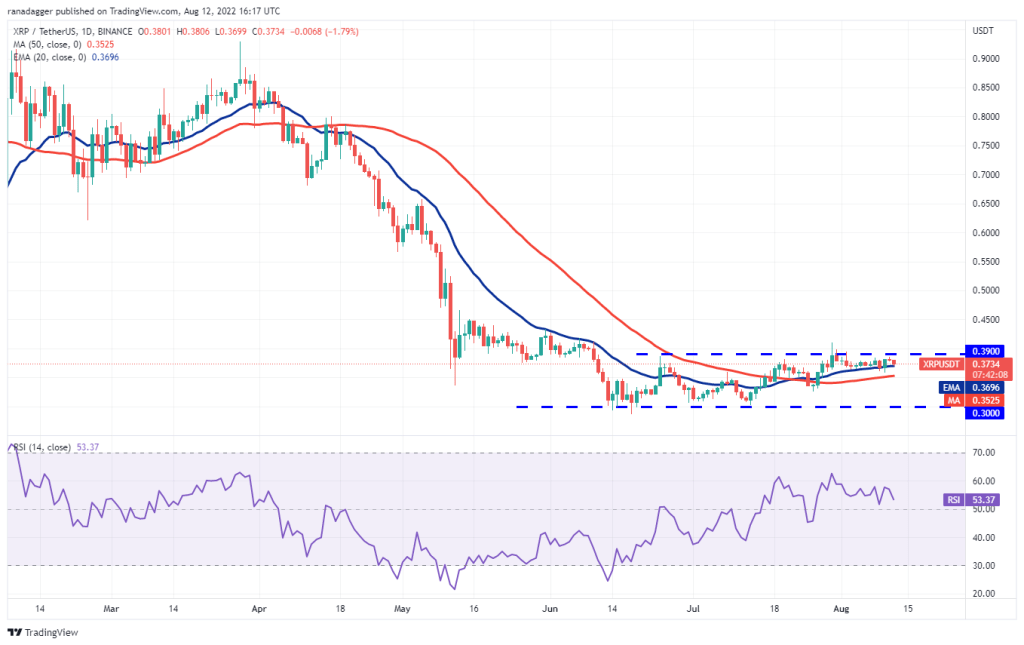
Buyers tried to push the price above $0.39 on August 11. But the bears held their ground. This suggests that $0.39 and the 50-day SMA ($0.35) are critical levels to watch out for in the short term. If the buyers break the general hurdle, XRP is likely to rally to $0.48 and later to $0.54. On the contrary, if the price breaks below the 50-day SMA, XRP is likely to slide towards the critical support at $0.30.
Cardano (ADA)
Buyers tried to push ADA above the overhead resistance at $0.55 on Aug. However, the bears successfully held the level. The price is now likely to drop to the 20-day EMA ($0.51).
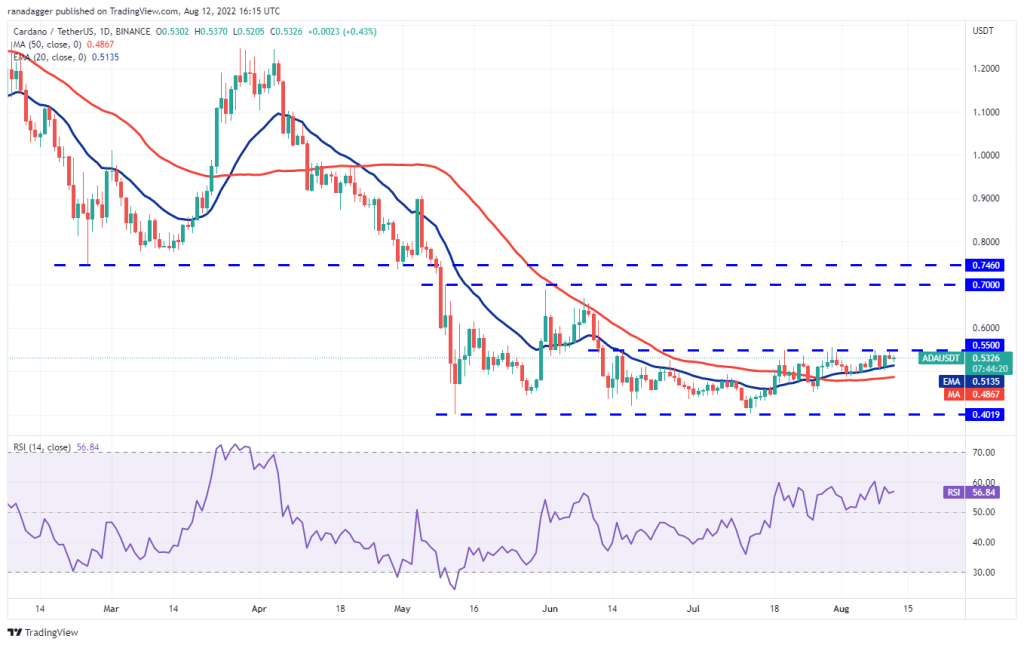
The narrow gap trading between the 20-day EMA and $0.55 is unlikely to continue for long. If buyers push the price above $0.55, ADA is likely to rally to $0.63 and then to the stiff overhead resistance at $0.70. Contrary to this assumption, if the price drops and dips below the 20-day EMA, the bears will try to push the support at $0.45. If support holds, ADA is likely to extend the consolidation between $0.45 and $0.55 for a while.
SOL, DOGE, DOT, MATIC and AVAX analysis
Left (LEFT)
SOL bounced off the 50-day SMA ($39) on Aug. This indicates that the bulls continue to buy at lower levels. The bulls tried to push the price towards the overhead resistance at $48. However, the bears stopped rebounding at $45.32 on Aug.
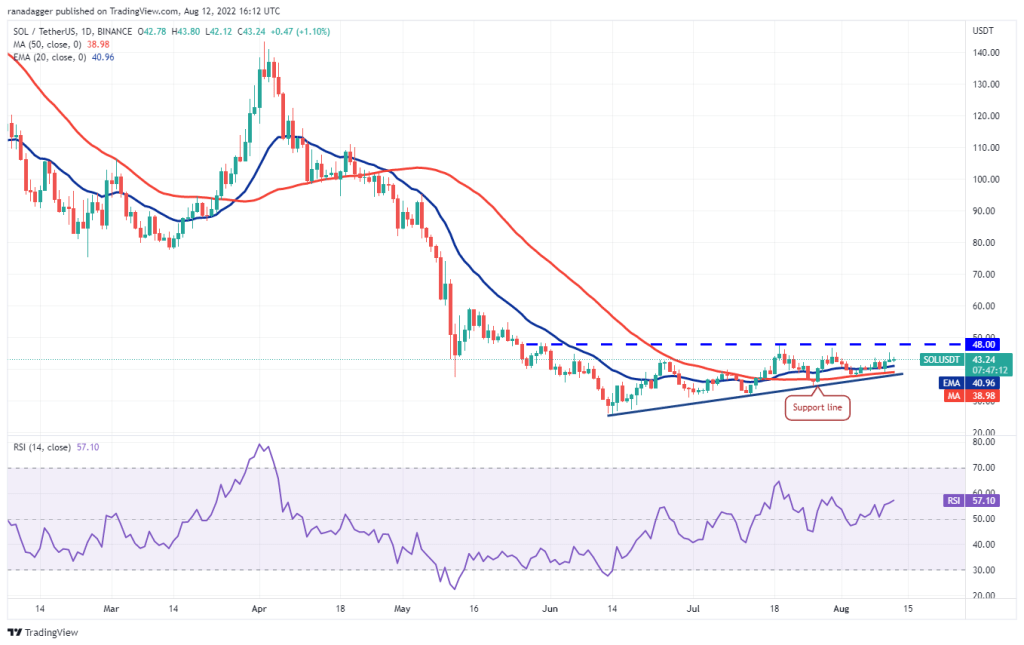
SOL is likely to continue trading within the ascending triangle pattern for a while. The bears will need to push the price below the support line to invalidate this bullish setup. Alternatively, the bulls will have to push and sustain the price above $48 to complete the bullish pattern. If this happens, it is possible for the SOL to rally to $60 and then stay at $71 and move to its target.
Dogecoin (DOGE)
DOGE once again bounced back from overhead resistance at $0.08 on August 11. This indicates that the bears continue to defend the level aggressively.
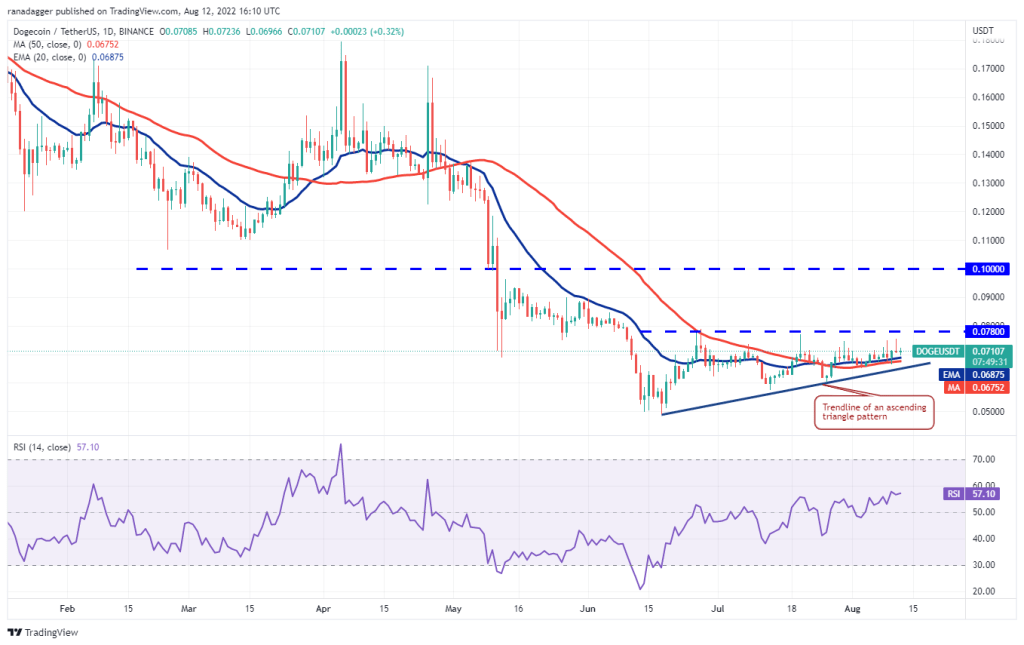
The bears will try to push the price below the moving averages and challenge the trendline of the ascending triangle pattern. A break and close below this support will invalidate the bullish setup. It will also open the doors for a possible retest of $0.06. Contrary to this assumption, if the price bounces off the moving averages, it will indicate that the bulls continue to buy at lower levels. The bulls will have to push the price above $0.08 to complete the ascending triangle pattern. If this happens, DOGE is likely to rally to $0.10.
Polkadot (DOT)
DOT is witnessing a close battle between the bulls and bears near the breakout level of $9. The bears are trying to push the price below $9 while the bulls try to turn the level to support.
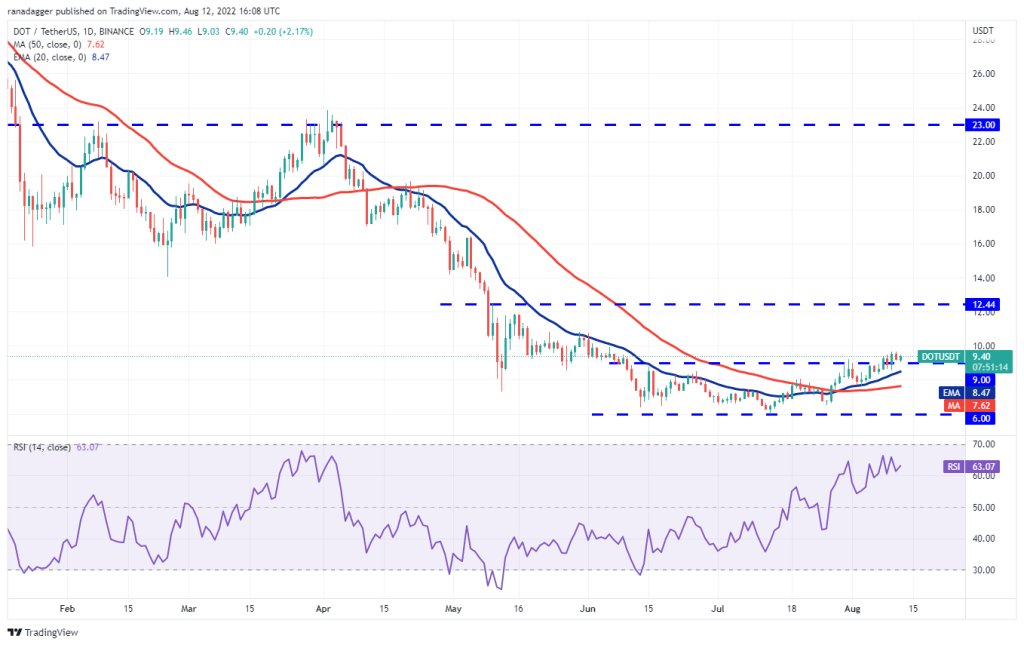
The rising 20-day EMA ($8.47) and the RSI in the positive zone are giving buyers an edge. If the price rises from the current level and rises above $9.65, it is possible for the DOT to rally to $10.80 and later to $12. Alternatively, if the price breaks below the strong $9 support zone and the 20-day EMA, it would suggest that the recent breakout could be a bull trap. The DOT is likely to drop to the 50-day SMA ($7.62) later.
Polygon (MATIC)
MATIC has been trading in a tight range between the 20-day EMA ($0.88) and $0.96 for the past few days. This indicates indecision between buyers and sellers.
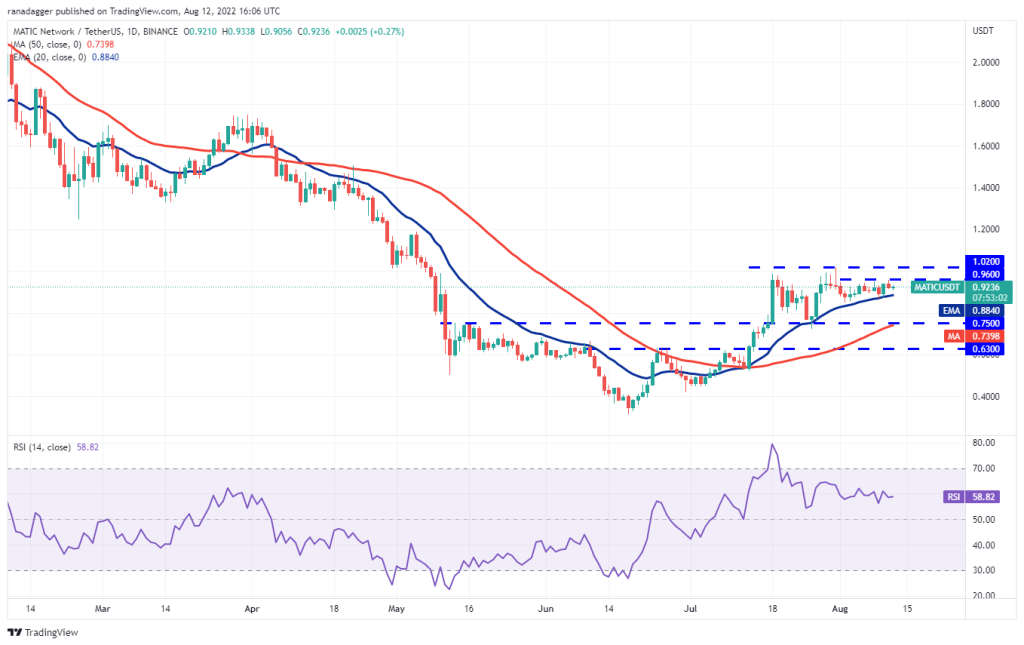
If this uncertainty resolves to the upside, MATIC is likely to rise to the stiff overhead resistance at $1.02. The bulls will have to break through this hurdle to signal that the next leg of the upward move has started at $1.26 and then $1.50. Contrary to this assumption, if the price drops and dips below the 20-day EMA, the short-term advantage is likely to turn in favor of the bears. MATIC is likely to drop to strong support at $0.75 later.
Avalanche (AVAX)
AVAX has been trading above the $26.38 breakout level for the past few days. This shows that the bulls are not in a hurry to give up their advantage.
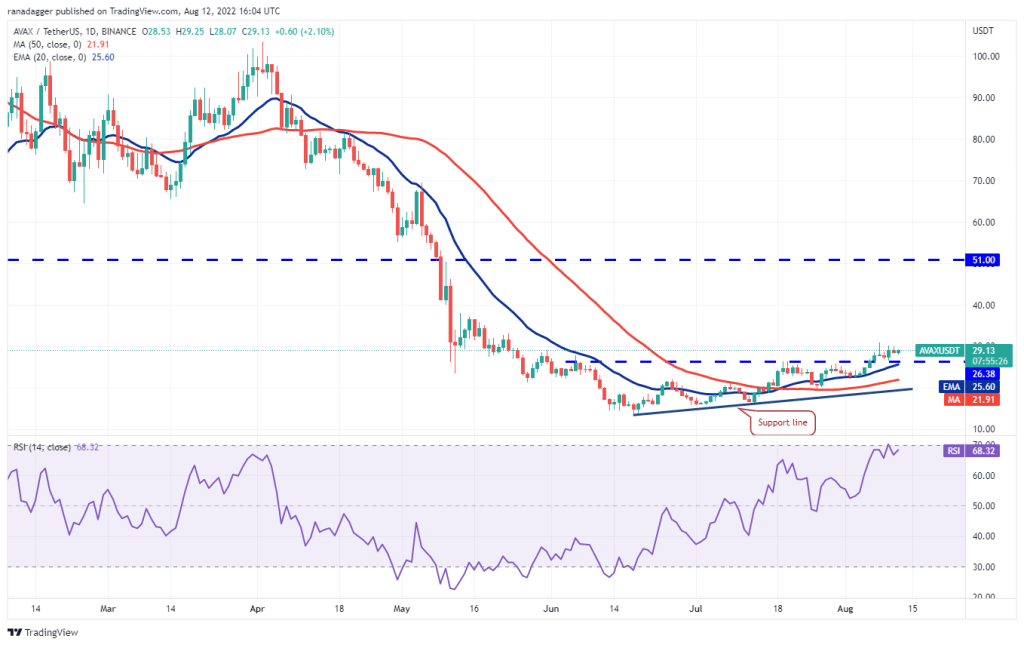
The gradually rising 20-days EMA ($25.6) and the RSI near the overbought zone suggest advantages for buyers. If the bulls push the price above $31, AVAX is likely to gain momentum. It is possible to rally to $33 and then to the $39.05 pattern target later on. This positive sentiment is likely to invalidate in the short term if the price drops and falls below the 20-day EMA. If this happens, AVAX is likely to drop to the 50-day SMA ($21.91) and then the support line.