
Bitcoin started a sharp decline and fell as low as $40,000. According to technical analysis by NewsBTC’s Aayush Jindal, it may continue to decline.
Bitcoin Dropped Hard
Bitcoin failed to stay above the $43,180 support level and fell sharply. The decline gained momentum below the $42,000 level and the 100 hourly simple moving average. There was also a break below a major bullish trend line with support near $43,600 on the hourly chart of the BTC/USD pair. The pair even broke the $40,500 support and dropped as low as $40,100.
It is currently consolidating losses below the $41,000 level. An initial resistance is near the $41,000 level. This is near the 23.6% Fib retracement level of the low from the $44,375 low to $40,100 low.
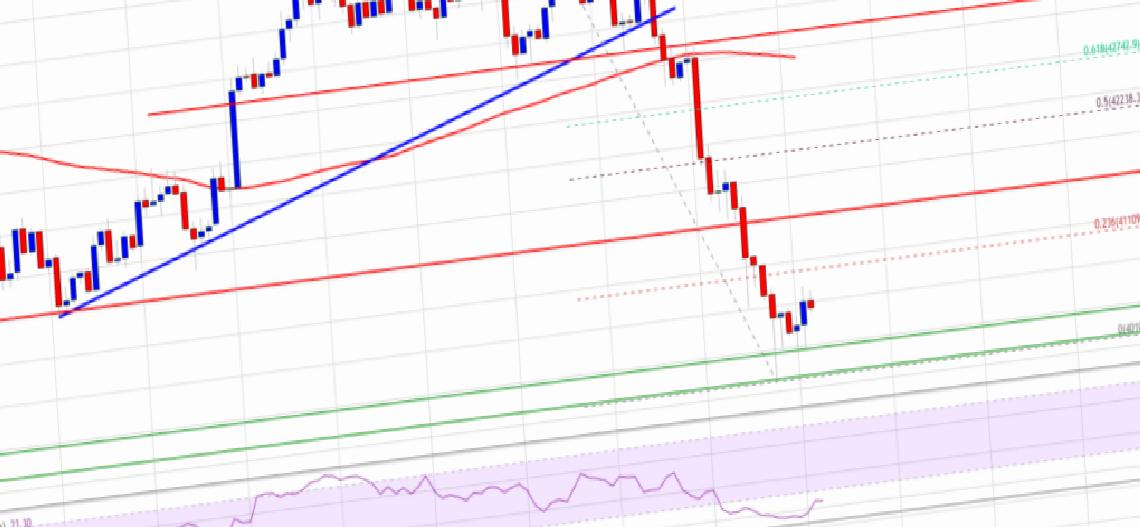
The next key resistance is near the $41,620 level. The main resistance is currently formed near the $42,250 level. This is close to the 50% Fib retracement level of the recent decline from the $44,375 high to $40,100 low. A clear move above the $42,250 resistance zone could start a decent uptrend. The next major resistance is near $42,750, above which the price could rise towards the $43,200 level.
Will Bitcoin Drop More?
Jindal says that if Bitcoin fails to start a recovery wave above the $41,000 resistance zone, it may continue to move lower. An immediate support on the downside is near the $40,350 area.
The next major support is seen near the $40,000 level. If there is a downside break below the $40,000 support zone, the price could gain bearish momentum for a move to $38,800.
What Do Technical Indicators Say?
- Hourly MACD – The MACD is now losing momentum in the bearish zone.
- Hourly RSI (Relative Strength Index) – The RSI for BTC/USD is well below the 50 level.
- Major Support Levels – $40,350 followed by $40,000
- Major Resistance Levels – $41,000, $41,650 and $42,250


