
Bitcoin is consolidating below the $48,000 resistance. According to technical analysis by NewsBTC’s Aayush Jindal, if BTC breaks through the $48,000 resistance zone, it could start a new rally.
Bitcoin Targets New High
Bitcoin started a minor downside correction after failing near the $48,200 level. There was a break below the 23.6% Fib retracement level of the upward move from the $44,469 low to $48,200 high. BTC even dropped below the $47,000 level but the bulls were active near the $46,800 and $46,500 levels.
Bitcoin is currently holding $47,000 and is trading above the 100 hourly simple moving average. It is facing resistance near the $47,600 level. There is also a major breakout pattern forming with resistance near $47,700 on the hourly chart of
BTC/USD. The next major resistance could be near the $48,000 area. A successful break and close above the triangle resistance followed by $48,000 could start a strong increase.
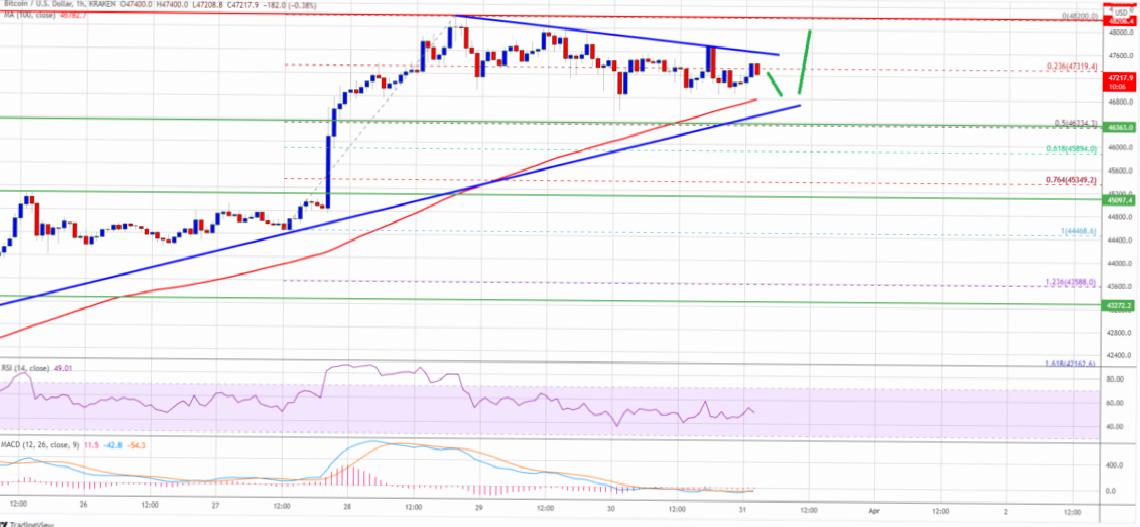
The next major hurdle could be near the $49,200 level. Any further gains could push the price towards the $50,000 level.
Are Drops Limited?
Jindal says that if Bitcoin fails to break through the $47,700 resistance zone, it could drop further. An immediate support is near the $47,000 region. The next major support is near the $46,800 level and the 100 hourly simple moving average. The main support is currently located near the $46,400 level. This is close to the 50% Fib retracement level of the upward move from the $44,469 low to $48,200 high. A downside break below the $46,400 support zone could send the price towards $45,000 in the near term.
What Do Technical Indicators Say?
- Hourly MACD – The MACD is slowly gaining momentum in the bullish zone.
- Hourly RSI (Relative Strength Index) – The RSI for BTC/USD is now just above the 50 level.
- Major Support Levels – 46,800 followed by $46,400
- Major Resistance Levels – $47,700, 48,000 and 48,200


