After Federal Reserve Chairman Jerome Powell consolidated his hawkish stance, the crypto market plunged into the red zone, led by Bitcoin, with some exceptions. Analysts are trying to predict the next direction of Bitcoin.
The analyst does not expect a rally for Bitcoin in 2023!
Widely followed crypto analyst Benjamin Cowen updates his 2013 outlook for Bitcoin (BTC), warning that both bears and bulls will be devastated. In a recent strategy session, Cowen says he believes the Bitcoin price will fluctuate for the rest of the year following the bearish market in 2022, mostly as it did in 2015 and 2019 after the bearish years. In this context, the analyst makes the following statement:
I think this year will chop both sides of the market participants, both the bulls and the bears. My overall expectation for this year. And I think some people want it to be a lot more complicated than that and say it’s either just going to be down or just going up. However, the truth is that if you look at 2015 and 2019, the years that followed were just bear market years, relatively volatile and blew both sides pretty easily. And I really don’t expect this year to be any different.

Cowen says he is watching to see if Bitcoin can stay above $22,200 in the near term. The analyst makes the following assessment:
In the short term, a daily close below $22,200 will start to look a little weak. If that doesn’t happen and we start to see a bullish breakout from the bottom of this channel, then there’s still room for potential upside here, though it’s not even making a new high. It could still test some of these previous levels (around $25,000) where it hasn’t been able to go up a bit and really spend a lot of time. However, I don’t think we will see a rally to the tops this year.
“Bitcoin traders should be careful!”
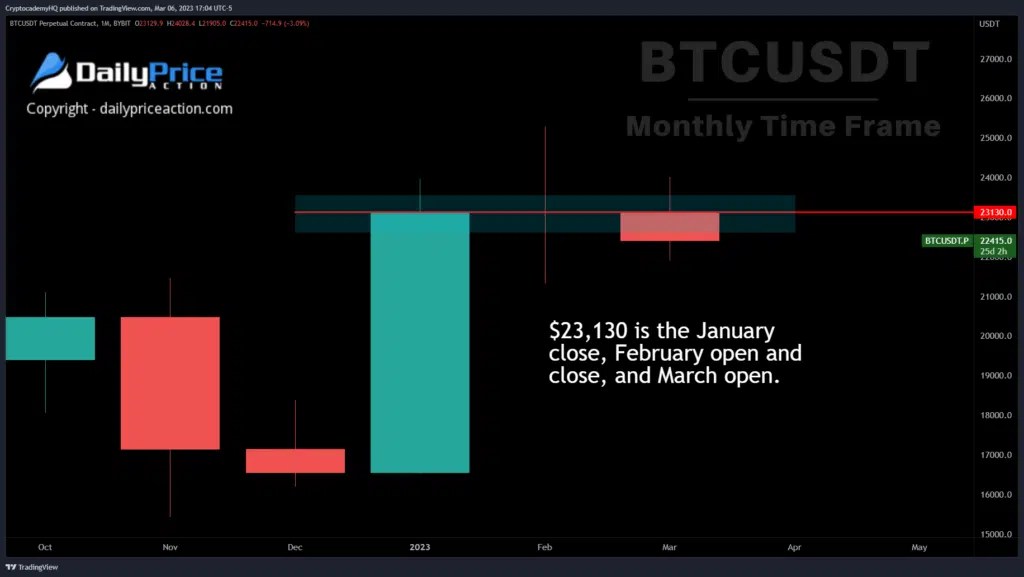
Crypto analyst Justin Bennett warns Bitcoin traders that bears are likely to prevail as long as crypto is trading below a key resistance area. The analyst says that the future direction of Bitcoin depends on whether BTC retraces the key $23,130 level. Bennett emphasizes that $23,130 so far this year is a very important area for Bitcoin.
 Source: Justin Bennett
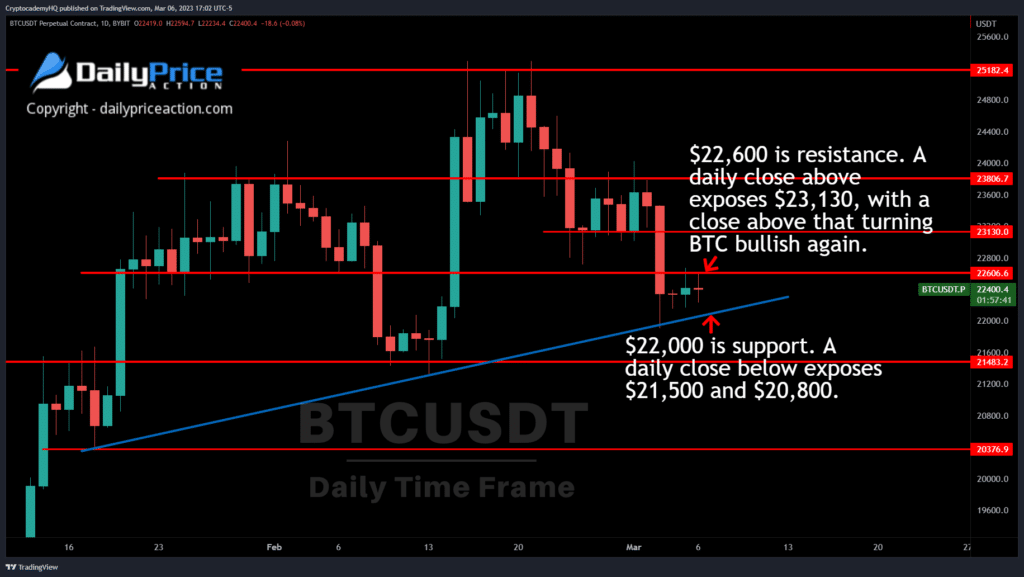
With Bitcoin trading below the analyst’s critical price level, Bennett says BTC bulls can count on a few support areas. If Bitcoin bulls make a comeback and take $23,130, Bennett thinks nothing will stop BTC from going up to $25,200. In this context, the analyst makes the following statement:
However, as mentioned above, I do not recommend short selling BTC when it is above the $22,000 January trendline. A daily close below $22,000 opens support at $21,500 and a pool of liquidity at $20,800. However, if BTC breaks the liquidity pool at $20,800, there isn’t much to stop a retest of the $20,000 support.
 Source: Justin Bennett
A higher bottom or the start of a downtrend?
According to Kitco senior technical analyst Jim Wyckoff, March Bitcoin futures prices rose slightly in early trading, but all changed in the afternoon as the futures price dropped to $20,020. “Bulls have lost their overall short-term technical advantage as an incipient price downtrend has formed on the daily bar chart and the bears have gained some momentum,” Wyckoff says.
According to the latest news release from Technical Roundup, Bitcoin continued to pull back from the monthly resistance at $23,300 and the main support area is located between $19,400 and $20,500.
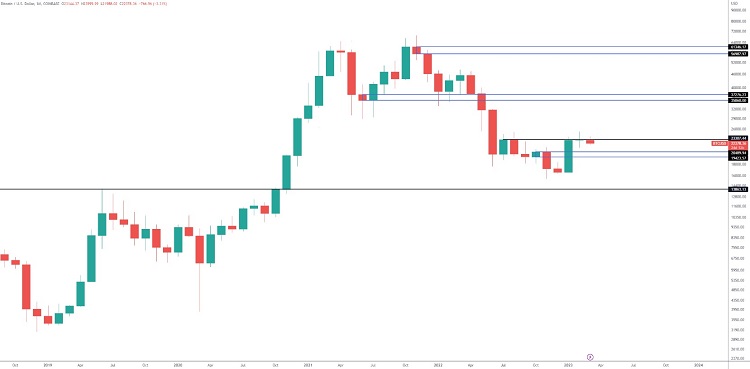 BTC 1-month chart. Source: Technical Roundup
The news release says the current debate among analysts is currently centered around ‘whether the current pullback will be a higher low before another high’. In line with this, “In our view, prudently, if this is a higher bottom, above the daily highest resistance, $23700, it becomes viable. More aggressively, the discussion can be made above the lower limit at $22600.
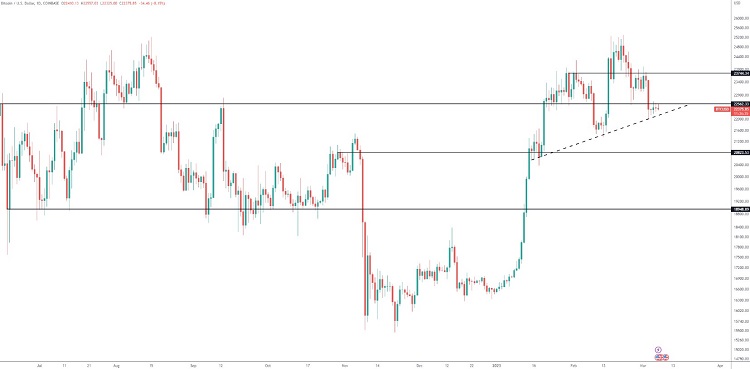 BTC 1-day chart / Source: Technical Roundup
Technical Roundup’s interpretation of the current market structure is based on two factors. The volatility experienced in this range and the fact that more well-defined support levels are near $20,000. “None of the range breaks have continued in any direction, so it may be premature to expect a clean market structure pattern,” analysts say.
Critical area for Bitcoin
As you follow on Kriptokoin.com, the volatility of the cryptocurrency market has been weak in recent weeks. BTC’s short-term implied volatility (IV) has recently dropped below 40% and trading volume has hit new lows. According to a Twitter post by market researcher and data analyst WuBlockchain, this indicates that BTC has entered an ‘extremely tight liquidity phase’.
According to on-chain data analytics firm CryptoQuant, more than 5,000 BTC have left exchanges in the last 24 hours as Bitcoin retests the $22,000 liquidity of long positions. The increase in BTC outflows from exchanges may support bullish investors. The less BTC available in the market, the more likely it is to hold above critical support. BTC fell significantly, posting corrections of 5.5% and 10% on the seven and fourteen-day timeframes, respectively. If bitcoin fails to hold above its nearest support, it looks set to visit lower levels such as $21,000 and $20,000.
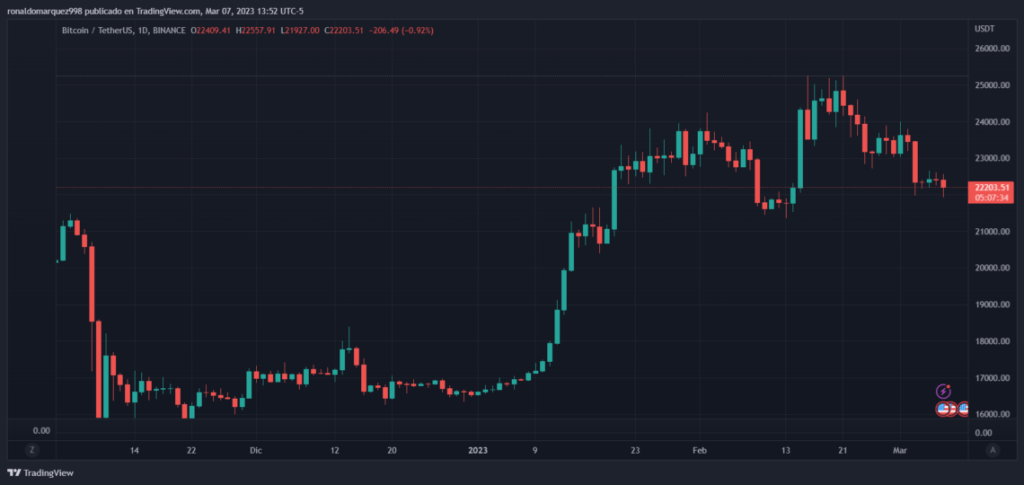 Bitcoin daily chart / Source: TradingView
Market sentiment is rising in Bitcoin!
According to Chris Burniske, former lead crypto analyst at ARK Invest, the current position of Bitcoin price on the chart is a matter of perspective. Some bearish traders may see a range move towards a breakout, while Burniske is catching an unstoppable beach ball.
The analyst emphasizes that macroeconomic indicators, especially the dollar index (DXY) and rates, are very important in determining the current state of Bitcoin. If both indicators are bearish, BTC could potentially break the $25,000 resistance level. Additionally, the analyst is closely watching the price action of Ethereum (ETH) against BTC as he believes it has the potential to increase significantly in the future.
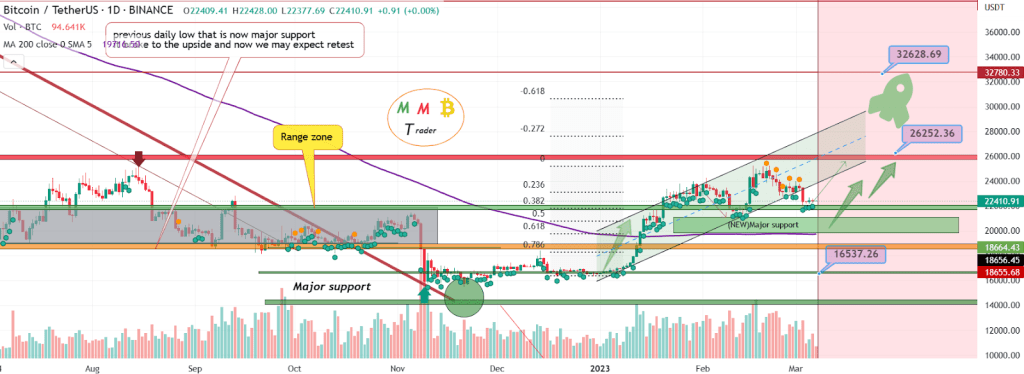
Although the price of Bitcoin is stuck in a low range of $20,000, there is a glimmer of hope as a high timeframe momentum tool. LMACD recently signaled a bullish crossover. This signal has previously resulted in a ROI of at least 1,000% for Bitcoin. While the selling pressure seems to have eased, Bitcoin’s price chart and several weeks of consolidation suggest a lack of buying activity. In the past, a trend reversal has been marked by momentum measurements appearing on a higher time frame.