
As we enter a new week, investors are focused on two big assets – gold and Bitcoin. In today’s article, we will cover analyst Ross J Burland’s comments on gold for the week and analyst Rakesh Upadhyay’s weekly BTC commentary.
What does the weekly gold chart herald?
According to the previous week’s analysis, the week’s gold chart was showing the opening pressure determined by the near-term resistance and highlighted by the daily chart as important. It could also be seen that the bulls were starting to challenge the commitments of the bears. According to gold analyst Ross Burland, this keeps the outlook bullish for the next week.
According to the chart above, the price of gold continued to test resistance as follows:
for gold “ blue sky is coming?
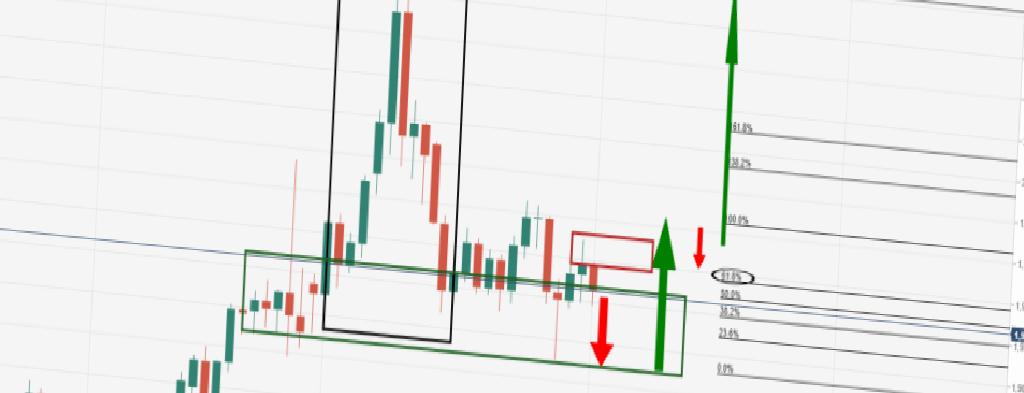
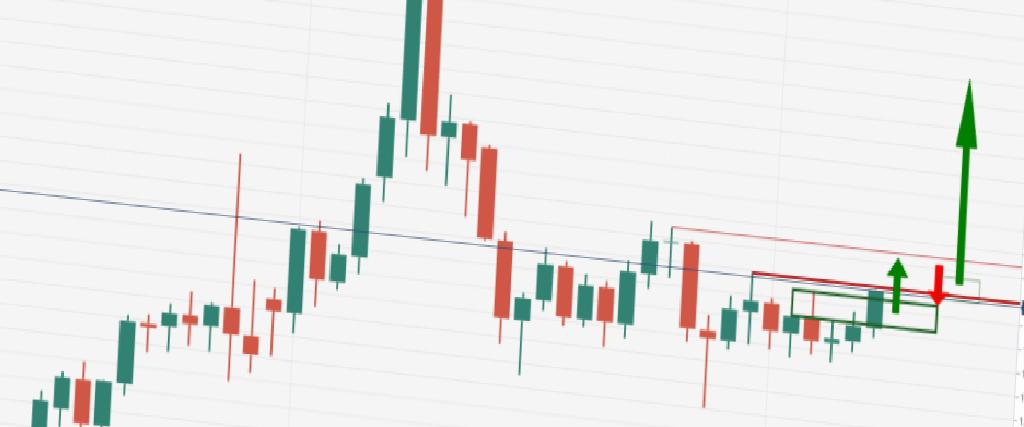
As shown, price broke the newly formed resistance and is now testing the previous resistance. The bulls are rushing to start the week on a bullish break and a break of $1,970 will likely see an upside extension for the coming week. The M-pattern was a pattern identified in the previous analysis:
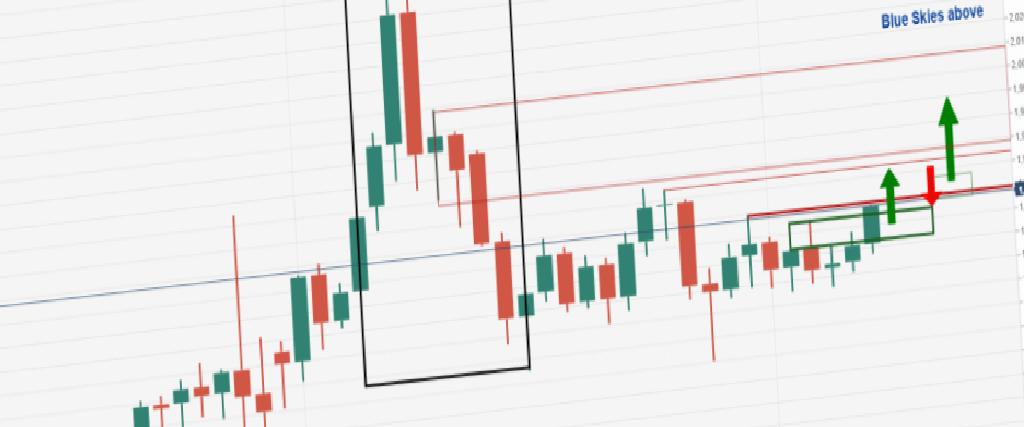
Burland points out that this is a reversal pattern and the neckline of the pattern will stretch to attract price. A break near $2,010 March 10 high will clear the way for “blue skies”.
Analyst explained the levels to watch for Bitcoin
When we look at the analysis for BTC, the largest cryptocurrency with its market value, analyst Rakesh Upadhyay gives the levels to watch. As we reported on cryptokoin.com, Bitcoin bounced from support at $42,594 on April 7, but the bulls failed to break the barrier at the 20-day EMA ($43,922) on April 8. According to the analyst, this may have attracted the selling of traders who pushed the price below the $42,594 support.
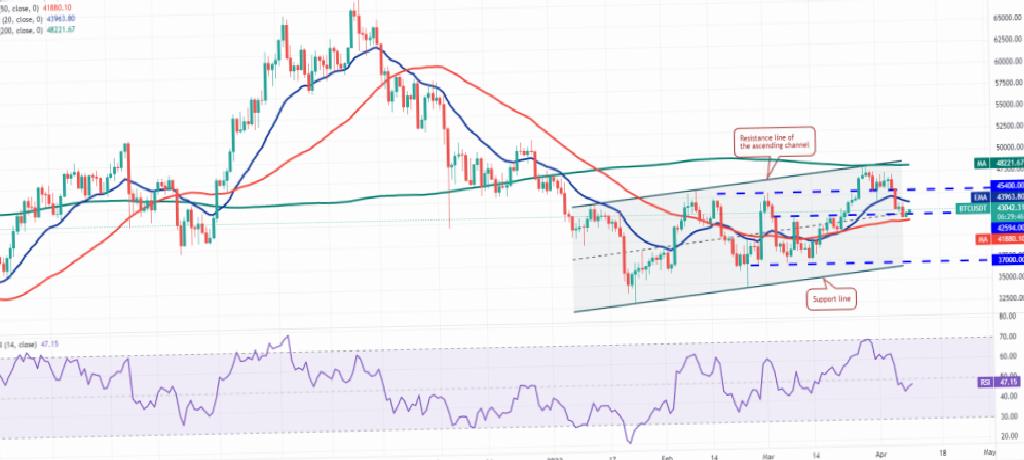
The analyst describes it as a “small positive case” as the bulls try to defend the 50-day simple moving average ($42,620). If the bulls propel and sustain the price above the 20-day exponential moving average ($43,923), it will increase the likelihood of range-bound moves in the near term. The BTC/USDT pair can then swing back and forth between the 50-day SMA and the 200-day SMA ($48,219) for a few days.
Bears and bulls clash for these levels
On the contrary, a weak bounce from the 50-day SMA would signal a lack of aggressive buying at current levels. The bears will then try to take advantage of this opportunity and push the pair below the 50-day SMA. “If they are successful, the pair could drop to the psychological level of $40,000, and if this level is broken, the next stop could be the support line of the ascending channel,” Upadhyay says.
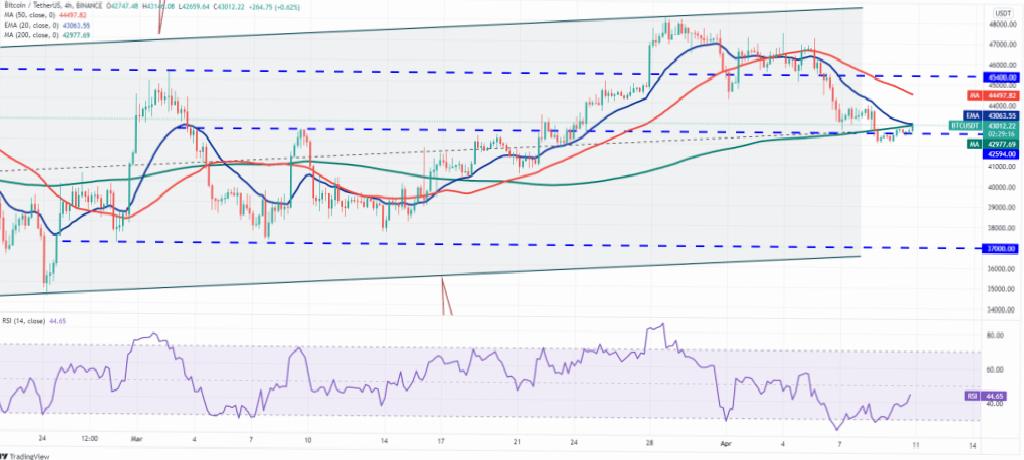
The 4-hour chart shows that the recovery movement of the $42,594 support has faded at the 20-EMA. This indicates higher levels of selling by the bears. According to Upadhyay, the 20-EMA is sloping down and the relative strength index (RSI) is in negative territory, giving sellers an advantage. Finally, the analyst uses the following statements:
If the price drops and falls below $42,000, selling could intensify. The pair could later slide back towards $40,000, where buyers can try to stop the decline again. Alternatively, a break and close above the 20-EMA could open the doors for a possible rebound at the 50-SMA. The bulls will have to push the price above $45,400 and sustain this area to gain the upper hand.


