After the neutral CPI data on August 10, Bitcoin and altcoins are preparing to break the stiff resistances. We can look at the technical analysis of the analysts to determine the critical levels for the coming days.
Ethereum price was just 1 step away from $2,000
The US CPI report dated August 10 showed that annual inflation in the country rose 8.5% in July. This figure fell short of economists’ expectations of 8.7%. Risky assets, including the cryptocurrency markets, responded positively to the CPI pressure. Compared to Bitcoin (BTC), altcoins are experiencing a stronger rally. This brought Bitcoin to yearly lows of dominance, while Ethereum (ETH) approached its yearly highs.
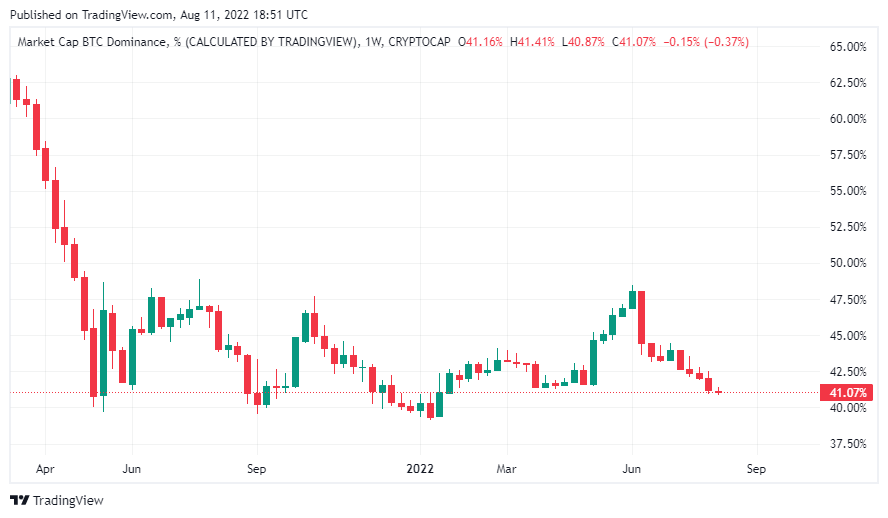
Ethereum-related products have seen $159 million inflows in the past seven weeks, according to CoinShares data. This indicates that Ethereum has caught the attention of institutional investors in anticipation of the merger scheduled for September 19. Can Bitcoin and altcoins sustain higher levels? To answer, let’s continue with the technical analysis of analyst Rakesh Upadhyay.
Next technical levels for Bitcoin, Ethereum and Dogecoin
Bitcoin (BTC) dropped from $24,245 on August 8 and bottomed at $22,966 on August 9. Later, the bulls aggressively bought the dip on August 10. They are now trying to push the price above the $24,668 resistance.
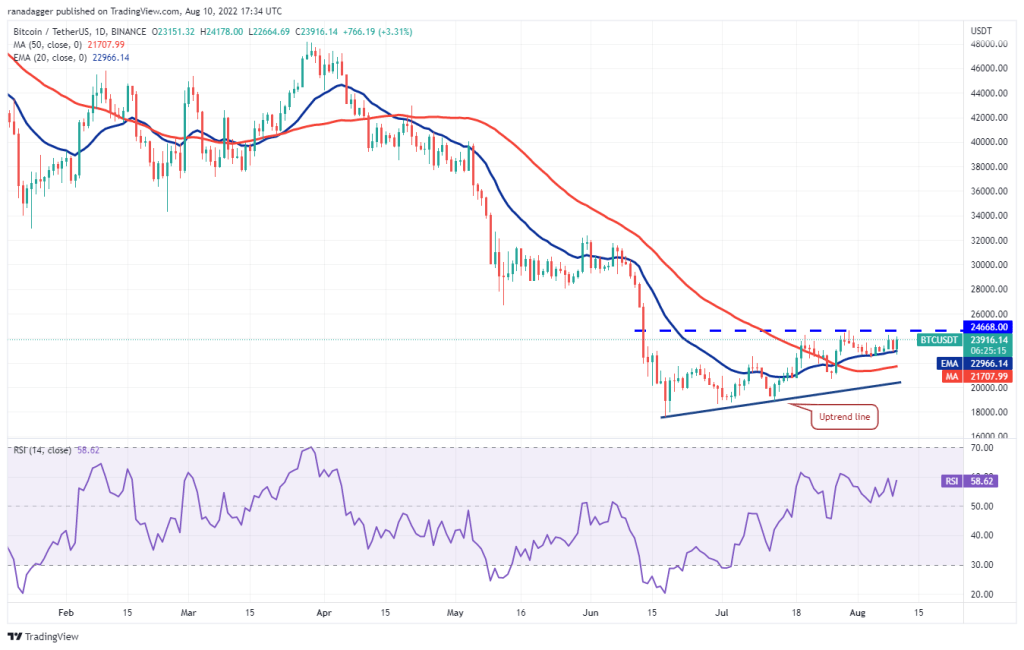
If they are successful, the Bitcoin price will gain momentum on the upside. The bulls’ first target is $28,000. Bears will build a strong wall at this level. If BTC manages to break through this hurdle, the bulls’ next target is $32,000. On the technical side, the slowly rising 20-day EMA and the RSI in the positive zone indicate the path of least resistance to the upside.
Conversely, if the price drops from $24,668, the bears will attempt to push the pair back below the 20-day EMA. If they succeed, BTC price will head towards $21,708. A break below this level turns the advantage in favor of the bears.
Ethereum (ETH)
Ethereum dropped from $1,818 on August 8, but the bears managed to hold the price at $1,637. This indicates strong demand at lower levels.
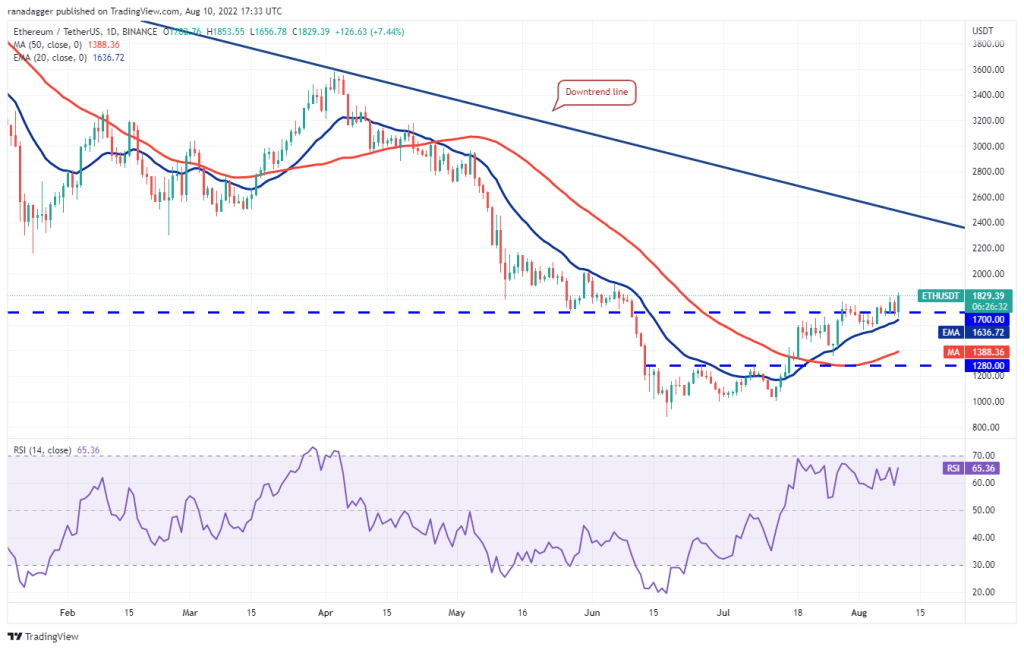
ETH hit $1,818 from the 20-day EMA on August 10. If buyers sustain the price above this level, the bulls’ next targets will be $2,000 followed by $2,200. The rising moving averages and the RSI in the positive zone suggest that the bulls have the upper hand. This bullish view will be invalidated if the price drops and breaks below the 20-day EMA. If this happens, ETH price will head towards $1,388. The analyst states that this scenario will delay upward movements.
BNB Coin (BNB)
BNB bounced back from the $338 resistance zone to $350 on August 8. However, the bears failed to sustain lower levels on August 10. This indicates that the bulls are buying the dips aggressively.
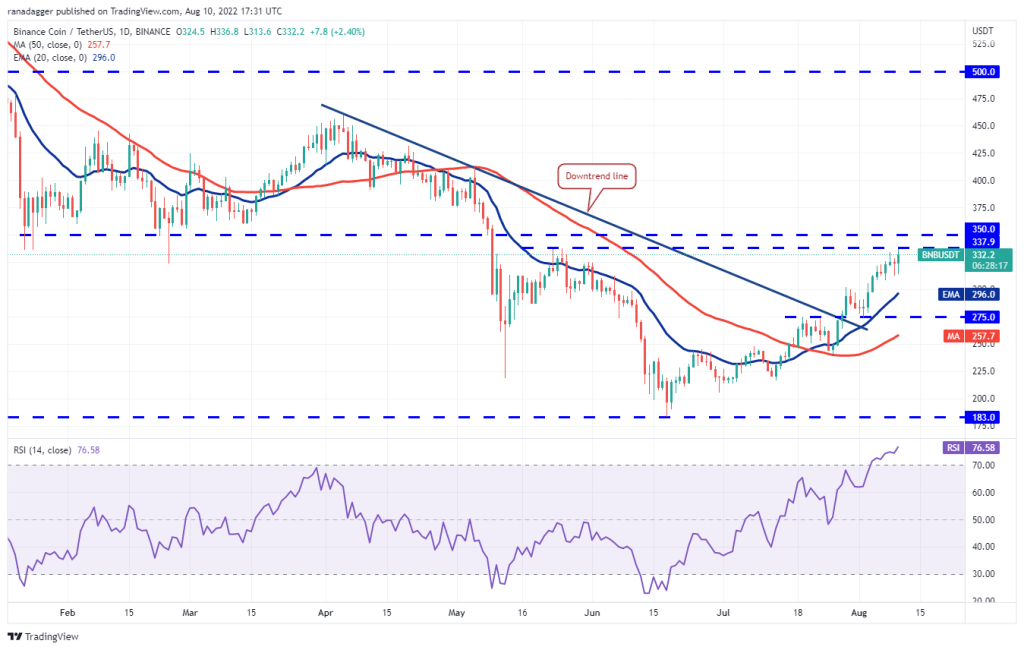
The bulls will again try to clear the top zone. If they are successful, the BNB price will gain momentum and the bulls’ first target will be $414. While the rising moving averages show advantages for buyers, the overbought zone on the RSI indicates that a minor pullback or consolidation is possible in the short term.
If the price breaks out of the general zone, the initial support is at $308. The bears will have to push the price below this level to challenge $296. This is an important level to consider because a breach of this level opens the way for $275.
XRP
The bulls failed to push XRP above the $0.39 resistance on August 8. This drew sharp selling from the bears, which pushed the price below $0.37 on August 9.
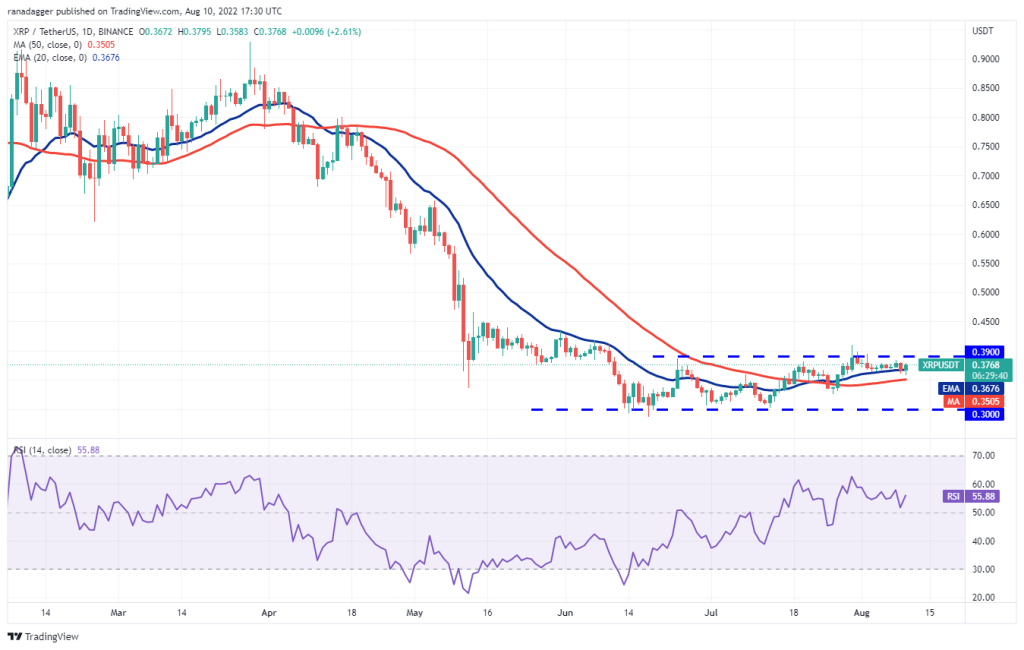
A minor positive is that the bulls buy the dip and push the price above the 20-day EMA on Aug. Buyers will again try to push the price above the overhead resistance zone of $0.39 to $0.41. If they are successful, XRP price will head towards $0.48 and then $0.54. Contrary to this assumption, if the price drops from overhead resistance and dips below 0.35, it will suggest that it will trade in the $0.30 to $0.39 range for a few more days.
Cardano (ADA)
Cardano (ADA) dropped the resistance level at $0.55 on August 8. On August 9, it reached $0.51. This indicates that the bears continue to aggressively defend the overall resistance.
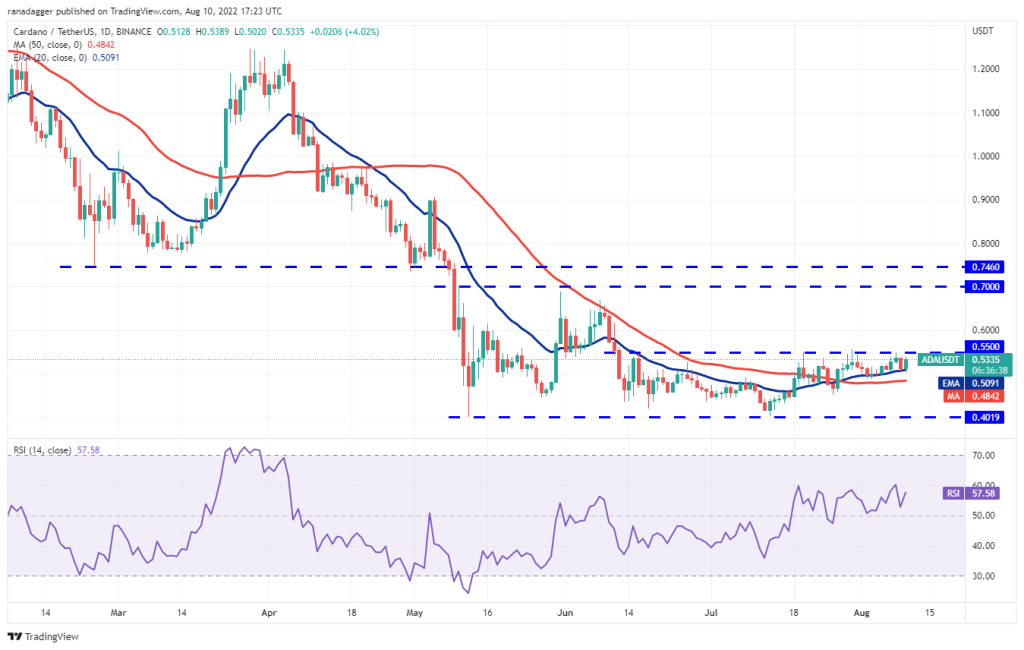
ADA price later rebounded sharply from the 20-day EMA on August 10. This shows that the bulls are buying the dips vigorously. If buyers break the general barrier, ADA price will start the upward walk at $0.63 followed by $0.70. Contrary to this assumption, if the price drops below $0.55 again, the probability of a break below the 20-day EMA increases. If that happens, it will be trading at $0.45 to $0.55 for a few more days
Left (LEFT)
The bulls tried to push Solana to the overhead resistance at $48 on August 8. But the bears had other plans. They halted the recovery attempt at $44 and pulled the price below $40 on August 9.
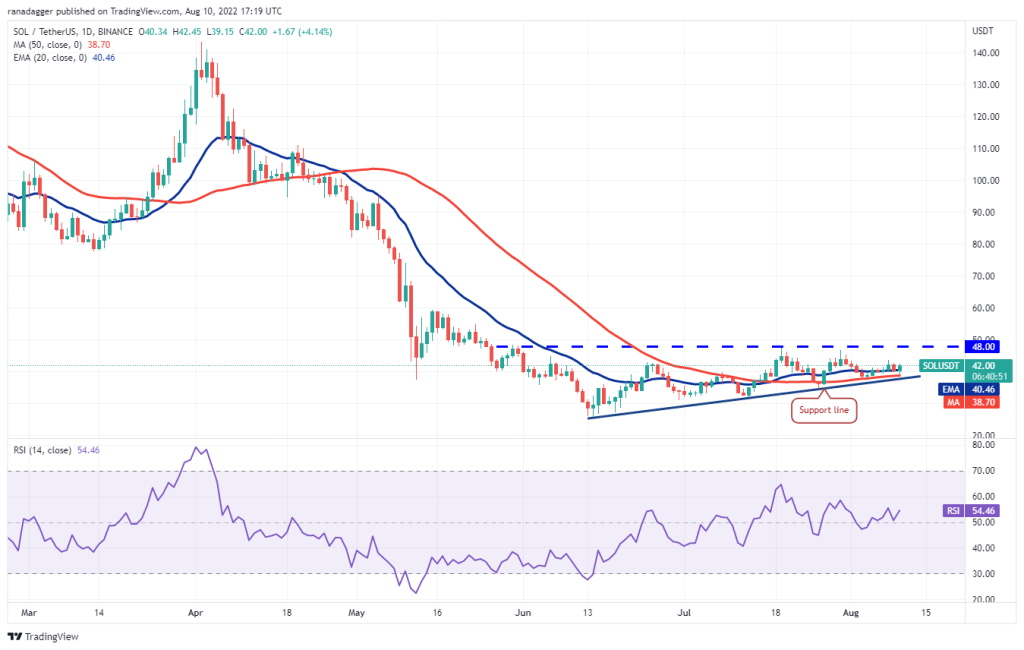
On the technical side, both moving averages are flattening out. The RSI is just above the midpoint, indicating a balance between supply and demand. If the price rises from the current level and rises above $44, the SOL will challenge the stiff resistance at $48. A break above this level will complete the ascending triangle pattern. It will open the doors for a possible rally to $60 followed by the $71 pattern target. Conversely, if the price drops from the current level and falls below the support line, the advantage will be in favor of the bears. According to the analyst, the price will then head towards $32.
Dogecoin (DOGE)
The long wick on Dogecoin’s (DOGE) August 9 candlestick shows that the bears are aggressively defending the overhead resistance at $0.08. Sellers try to increase their advantage by pulling the price below the moving averages.
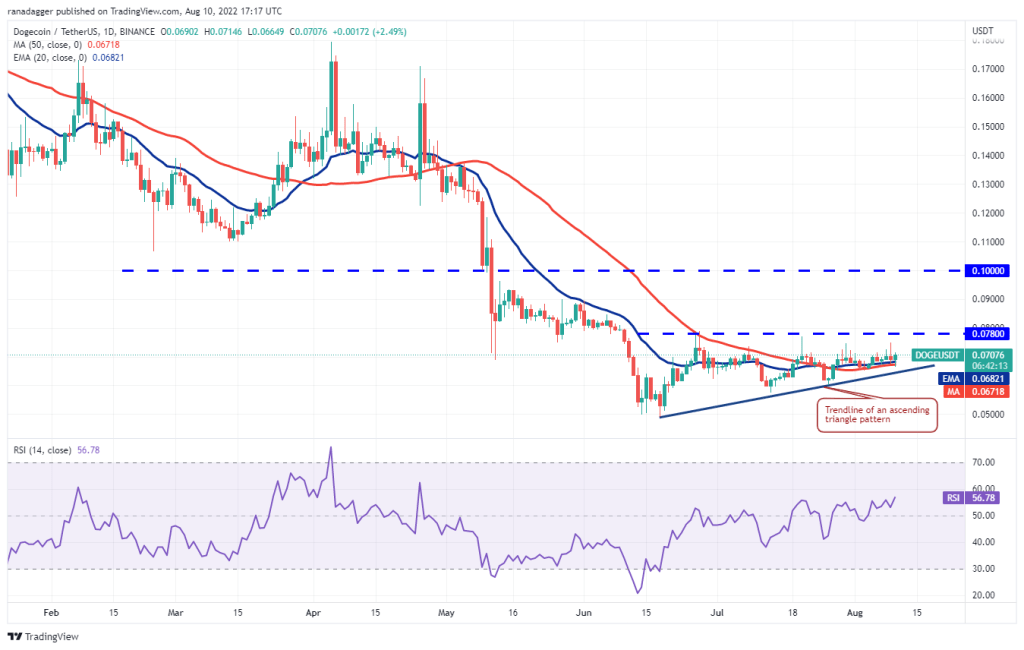
If successful, DOGE price will fall to the trendline of the ascending triangle pattern. A break and close below this support will invalidate the bullish setup. According to the analyst, its price will head towards $0.06 later. Conversely, if the price rises from the current level, it indicates that the bulls continue to buy on the dips. The bulls will then make another attempt to push the pair above the overhead resistance. It will also initiate a new upward movement. If they are successful, the bulls’ first target is at $0.10.
Polkadot (DOT)
Polkadot (DOT) broke the overhead resistance at $9 on August 8 and closed. However, the bulls failed to build on this strength. The bears sold aggressively and pushed the price below $9 on August 9.
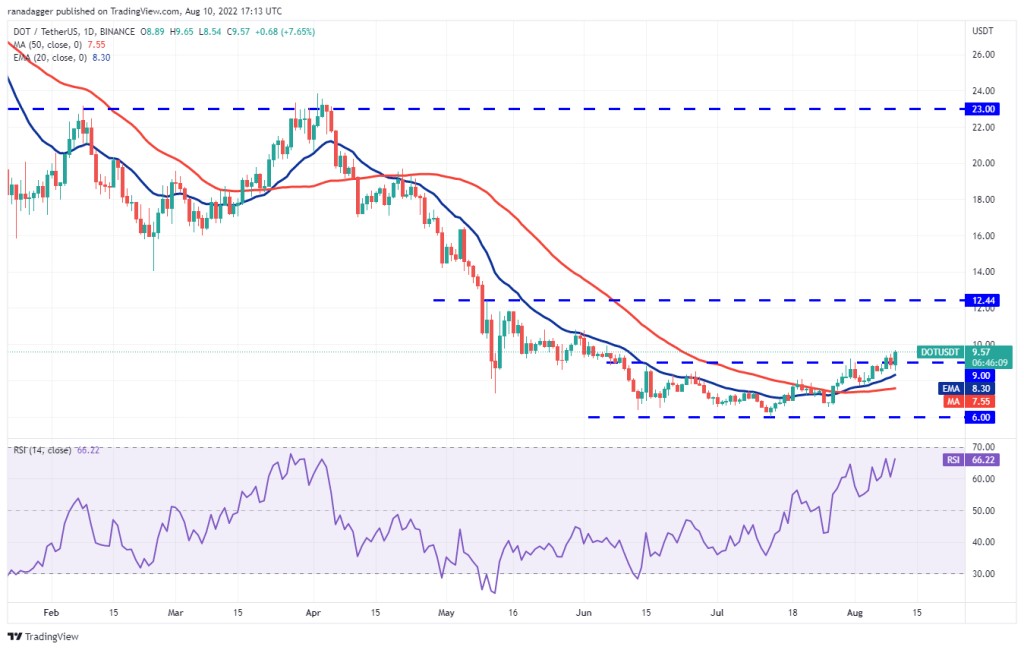
However, a positive sign is a sharp rebound in DOT price to $8.30. This shows that sentiment has turned positive and investors are buying on the dips. The bulls will try to push the price towards $10.80 and then $12. To invalidate this view, the bears will need to push the price below the 20-day EMA. Such a move would indicate that higher levels continue to attract strong selling by the bears. This means I will be trading in the current range for a few days.
Polygon (MATIC)
The bulls managed to hold MATIC price above $0.87 for a long time. However, they were unable to challenge the overhead resistance at $1.02. This indicates a lack of demand at higher levels.
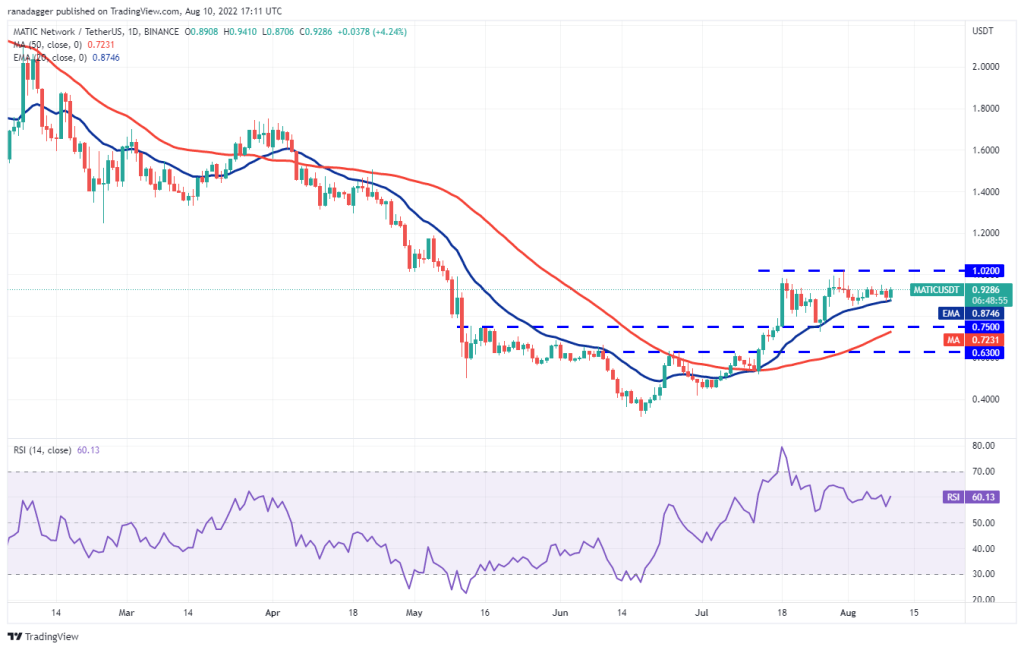
The slowly rising 20-day EMA and the RSI in the positive zone indicate that the bulls have the upper hand. If buyers push the price above $0.95, the MATIC will rise towards the overhead resistance at $1.02. This is an important level to defend for the bears because a break above it would result in a rally to $1.26 and then $1.50. Alternatively, if the price drops from the current level and breaks below the 20-day EMA, it means that MATIC price will be trading between $0.75 and $1.02 for a while.
Avalanche (AVAX)
The long wick on Avalanche’s (AVAX) August 8 candlestick indicates that the bears are not giving up and continue to sell in the rallies. The price returned to the exit level on August 9th. However, the bulls successfully defended the level on August 10.
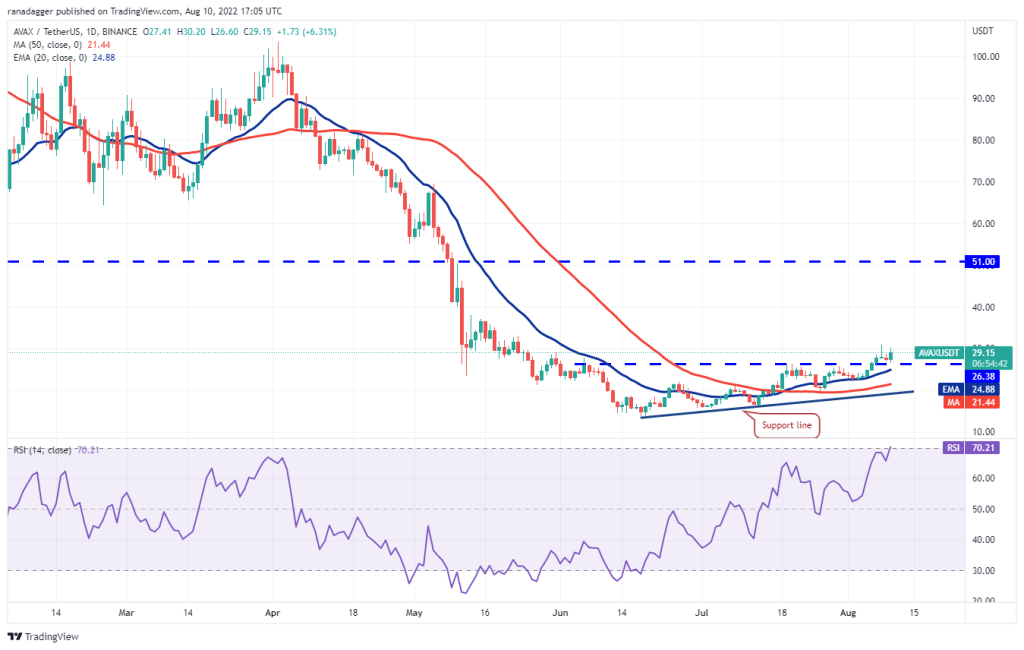
If buyers continue to rally, AVAX price is likely to head above the overhead resistance at $31. If this happens, it will continue its upward move to $33 and then to the $39.05 pattern target. The key level to watch on the downside is at $24.88. If the bears sink the price below this support, it would suggest that a break above $26.38 could be a bull trap. The price will then head towards the support line.