The Bitcoin (BTC) price chart shows an interesting pattern that signals a consolidation. This pattern reveals the short-term bullish outlook and macro bearish scenario for BTC. As Kriptokoin.com, we convey analyst opinions and BTC technical price analysis. You can see the Bitcoin (BTC) price and detailed market data here.
Macro view reveals that BTC is under pressure
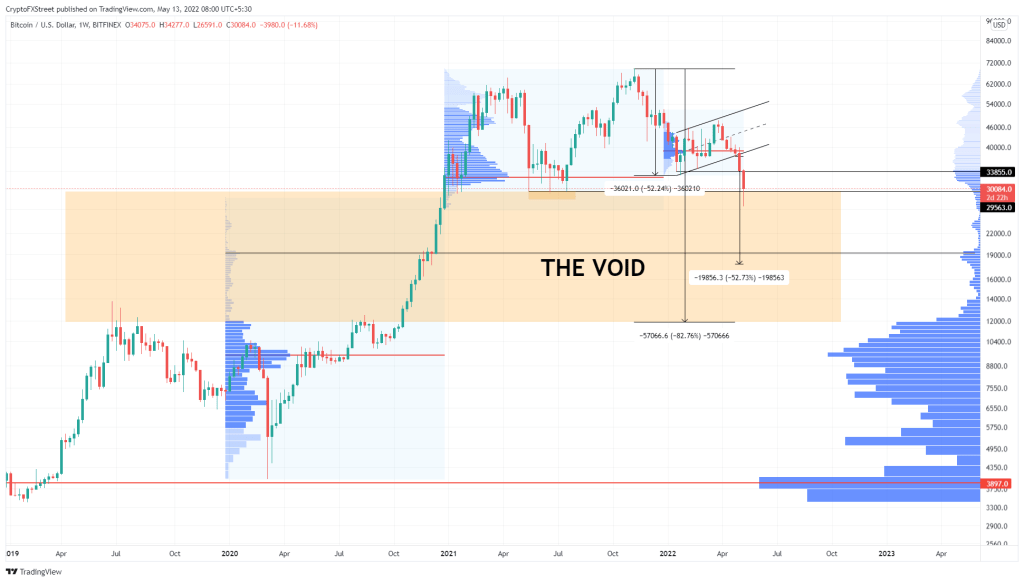
Bitcoin price dropped nearly 61 percent from an all-time high of $69,000 to a recent low of $26.591. This massive drop comes as BTC breached the bear flag formation on May 5. While the pattern shows Bitcoin to drop 52 percent to $17,803, there are multiple technical indicators that come to a similar conclusion. The weekly chart as shown below includes the volume profile for 2020, 2021 and 2022. The most striking data are seen in the 2020 and 2021 profiles. The indicator shows that almost no volume is traded as the Bitcoin price rose 556 percent between September 7, 2020 and April 12, 2021. To be precise, this gap in volume occurs between the price range of $11,891 to $29,424. Due to the exponential nature of the market, the Bitcoin price skyrocketed, outpacing the inefficiencies.

The conclusion to be drawn from these data is that the continued collapse could see BTC bottom as 11,891 under an extremely dire scenario. However, using the data of the volume profile indicator from 2019 to 2022 shows that the first line of support is at $19,500. Therefore, the loss to $11,891 could disperse early at this level, which could potentially act as a macro bottom. Interestingly, many investors expect BTC to stabilize around this level… Famous author Robert Kiyosaki commented on Bitcoin:
BITCOIN IS CRASHING. That’s great news. As mentioned in previous Tweets, I expect Bitcoin to drop to $20k. It will then wait for the bottom test, which could be $17,000. I’ll add when it’s at the bottom. Crashes are the best times to get rich. Be careful.
Bitcoin price will bounce back, but temporarily
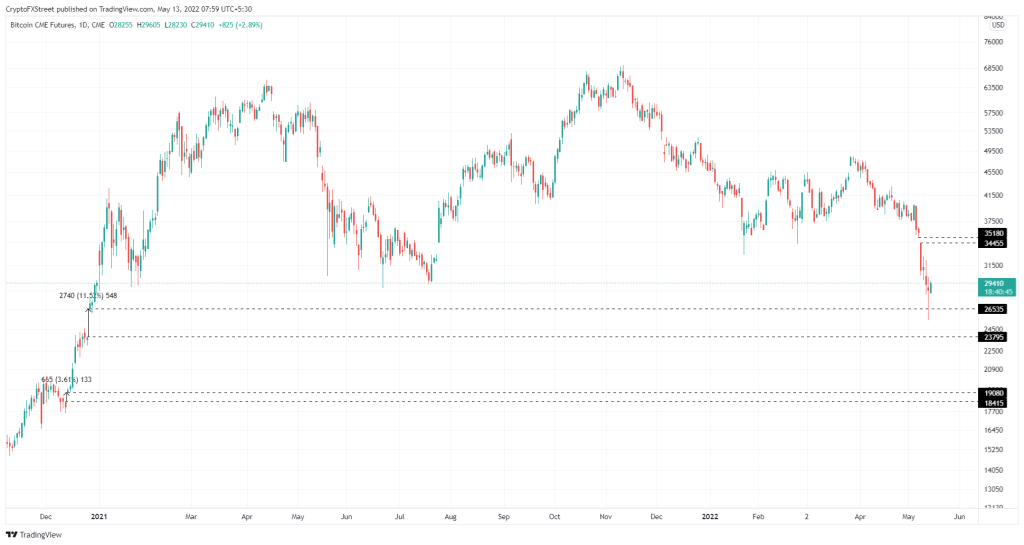
While techniques from a higher time frame suggest the possibility of a crash being steep, the short-term outlook is not so bleak. Lower timeframe techniques point to the possibility of a small relief rally. Bitcoin CME data (Chicago Mercantile Exchange) shows gaps in price action on multiple levels. These gaps usually occur on weekends when the CME stops trading but the crypto markets resume. Due to natural movements in spot prices, the CME data for BTC produces these gaps and these gaps are filled at a later date when the bitcoin price is trading. Sometimes, these gaps serve as a self-fulfilling prophecy. As of this writing, there are three notable vacancies: $19,080 to $18,415, $26,535 to $23,795, and $35,180 to $34,445.

Although the first range fits perfectly with the techniques discussed in the macro perspective above, the remaining gaps are important from a short-term perspective. Although BTC has fallen into the gap between $26,535 and $23,795, it seems like the bulls are stepping in. As a result, Bitcoin price started a relief rally. If this bullish outlook continues, there is a good chance that the uptrend will fill the upside first. Interestingly, the macro support-inverted resistance level of $34,752 is also present in this range. Therefore, the upside limit is around $35,000. In total, the small increase will constitute a 15 percent increase in the coming hours or days.
If psychological level is exceeded, all-time high may come
While looking for Bitcoin price from a short-term perspective, target consolidation from the bear flag, volume profile view and CME data indicate that more collapse in Bitcoin price may occur. . Therefore, investors need to be careful and not be enthusiastic if BTC or altcoins start to rally. However, the invalidation of the bearish thesis will occur only after a weekly candlestick closes above $52,000. This move will produce a higher high from a macro perspective, implying that the bulls are back. In such a case, Bitcoin price will hit the psychological level of $60,000 and eventually reach an all-time high of $69,000.
