
Bitcoin failed to gain momentum above $40,700 and traded at a new weekly low. According to technical analysis by NewsBTC’s Aayush Jindal, BTC may struggle to climb above $39,200.
Bitcoin Drops Hard
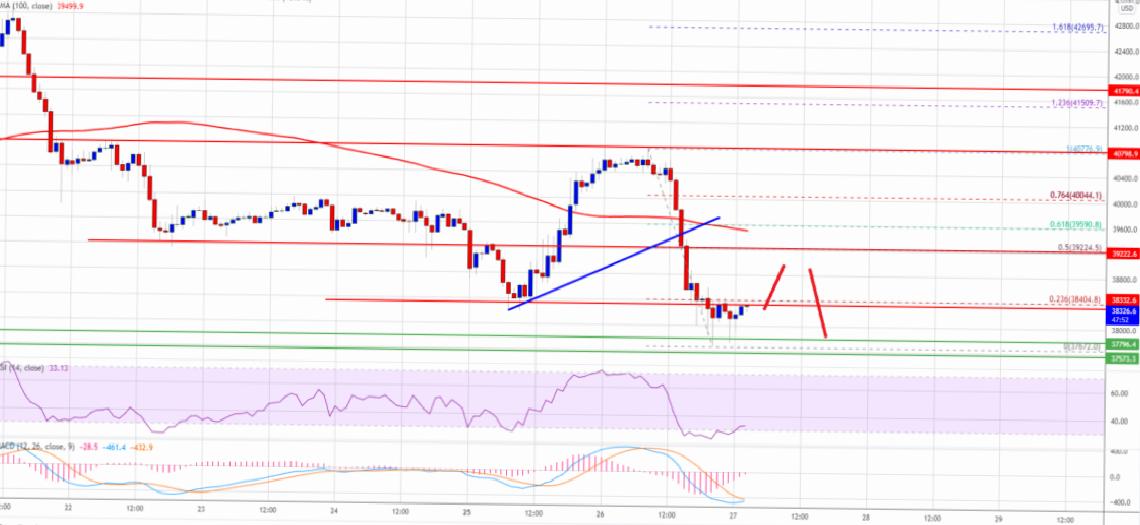
Bitcoin attempted a clear move above the $40,500 level. However, it failed to clear the $40,700 and $40,750 resistance levels. A top was formed near $40,776 and the price reacted to the downside. There was a sharp decline below the $40,000 level and the 100 hourly simple moving average. There was also a break below a connecting bullish trend line with support near $39,500 on the hourly chart of the BTC/USD pair.
Bitcoin is now trading below $39,000 and the 100 hourly simple moving average. It dropped as low as $37,672 and is currently consolidating losses.
An immediate resistance is near the $38,800 level. The next key resistance could be near the $39,200 area. The 50% Fib retracement level of the drop from the $40,776 high to $37,672 low is also near the $39,250 zone. The main resistance is now forming near the $39,550 level and the 100 hourly simple moving average.
$39,550 Significant
BTC could start a decent uptrend if there is a clear move above the $39,200 and $39,550 levels. In the stated case, it could even surpass the $40,000 resistance. The next major resistance could perhaps be near the $40,700 area.
Will Bitcoin Drop More?
Jindal says that if Bitcoin fails to break through the $39,200 resistance zone, it may continue to move lower. An immediate support on the downside is near the $37,650 level. The next major support is seen near the $37,500 level. A close below the $37,500 support zone could start another decline. In the stated case, the price could drop to $36,200.
What Do Technical Indicators Say?
- Hourly MACD – MACD is slowly losing momentum in the bearish zone.
- Hourly RSI (Relative Strength Index) – The RSI for BTC/USD is currently well below the 50 level.
- Major Support Levels – 37,650 followed by $37,500
- Major Resistance Levels – 39,200, 39,550 and 40,000


