Bitcoin tried to break out of its range in the first half of last week, but the bulls failed to sustain higher levels. Bitcoin is back in the range and trading close to the $26,000 level. Price action over the past few days has created two consecutive Doji candlestick patterns on the weekly chart, indicating uncertainty about the next directional move. Meanwhile, analyst Rakesh Upadhyay revealed 4 altcoin projects worth following. Only a handful of altcoins show signs of strengthening in the short term, according to the analyst. Here are the details…
The first altcoin on the list: TON
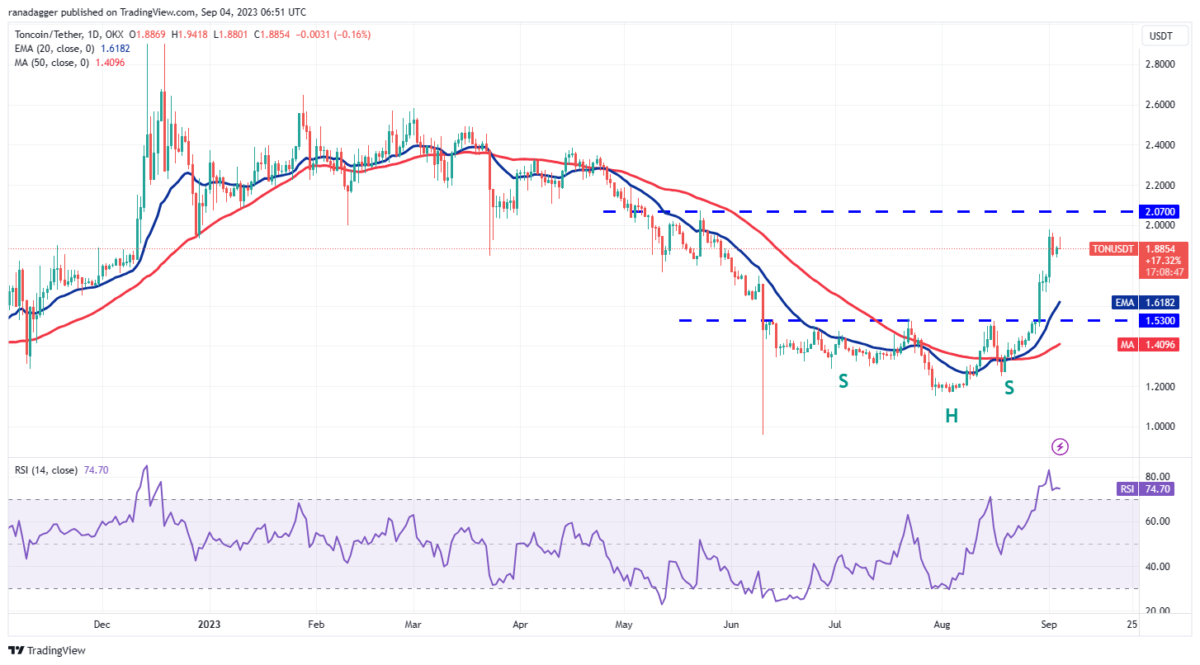
Toncoin (TON) is in an uptrend, but the bears are trying to stop the upside move near the overhead resistance of $2.07. Both moving averages are bullish, pointing to an advantage for buyers, but overbought levels on the RSI suggest a minor correction or consolidation is possible. If the bulls do not give up too much from the current level, the probability of a rally above $2.07 increases. The TON/USDT pair could then rise as high as $2.40. Conversely, a deeper correction could pull the price towards the 20-day EMA ($1.61). A strong bounce from this level will indicate that sentiment remains positive and traders are buying on the dips. If the 20-day EMA support is broken, the trend will turn negative.
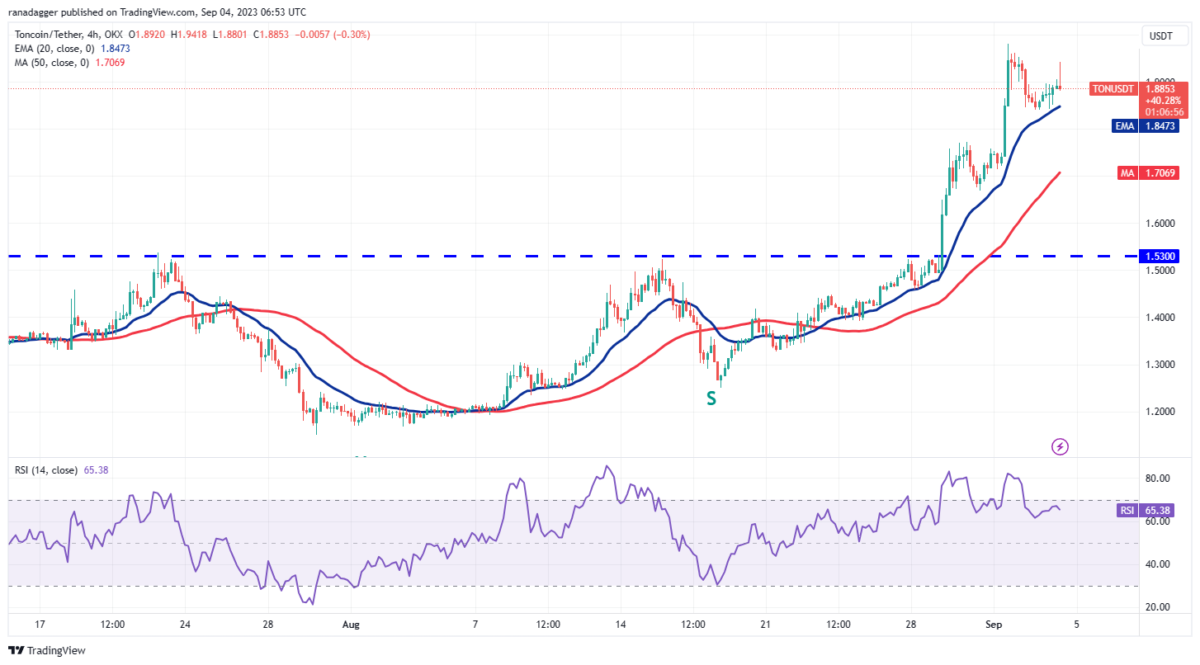
The 4-hour chart shows the bulls buying the retracement to the 20-EMA. Buyers will need to push the price above $1.98 to signal the resumption of the uptrend, but the bears may not give up easily. Sellers will try to push the price below the 20-EMA. If they do, the pair could initiate a deeper pullback towards the 50-SMA. A bounce from this level is likely to face selling at the 20-EMA, but if this roadblock is cleared, it will indicate that the bulls are back in the driver’s seat.
Chainlink price analysis: What’s next?
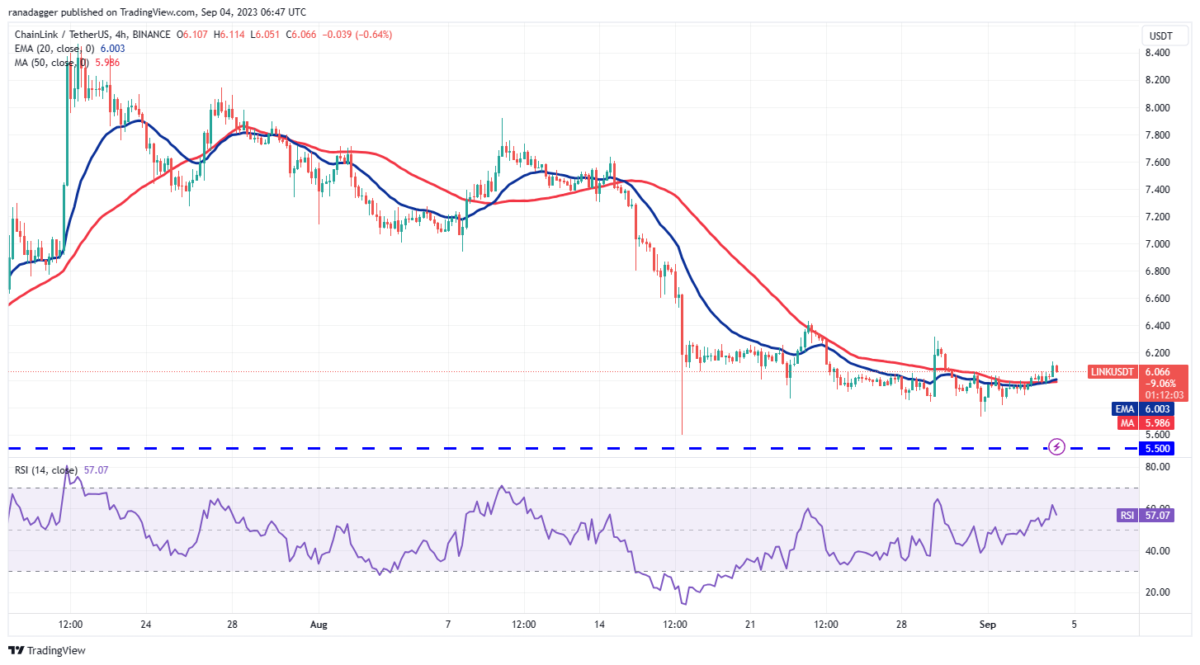
Chainlink has been trading in a wide range between $5.50 and $9.50 for the past few months. The bears pushed the price below the support of the range on June 10, but failed to sustain lower. The LINK/USDT pair fell close to the range support on August 17, but the bulls bought the drop, as evidenced by the long tail on the day’s candlestick. Buyers are attempting to start a recovery but are facing resistance near the 20-day EMA ($6.23). So this becomes an important level to watch out for.
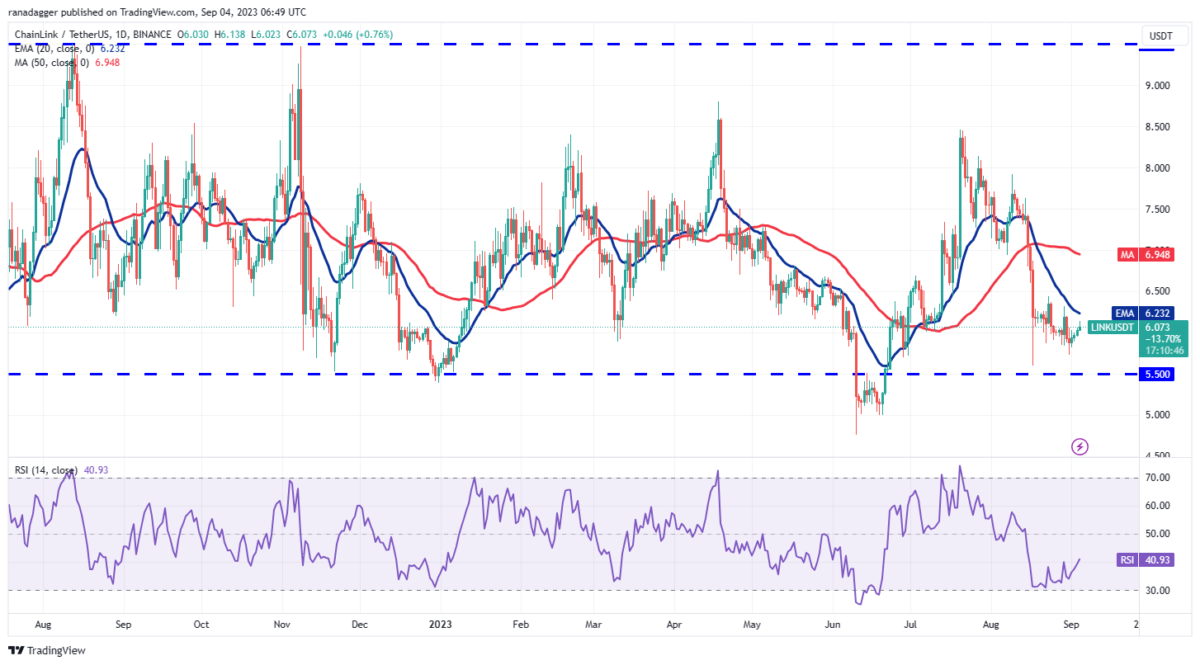
If buyers push the price above the 20-day EMA, the pair could begin its journey towards the 50-day SMA ($6.94). A minor resistance is at the $6.40 level, but it is likely to be surpassed. Conversely, if the price drops sharply from the 20-day EMA, it will indicate that sentiment remains negative and traders are selling in rallies. This could bring the price down to $5.50. The moving averages have flattened on the 4-hour chart and the RSI is just above the midpoint. This shows that the selling pressure is decreasing. Buyers will need to push the price above $6.40 to start a fresh upward move. The pair could rally to $6.87 and later to $7.07.
Maker is among the coins that are expected to rise
Maker holds support near $1,000, but the bulls are facing solid resistance from the bears near the downtrend line. The bulls have pushed the price above the downtrend line multiple times over the past few days but failed to sustain higher. A small positive point is that the buyers did not give up much, which indicates that the traders did not empty their positions in a hurry. If the price rises and closes above the downtrend line, it will indicate that the buyers are back in the game. The positive momentum is likely to increase after buyers push the price above $1,227. The pair could rally to $1,370 later.
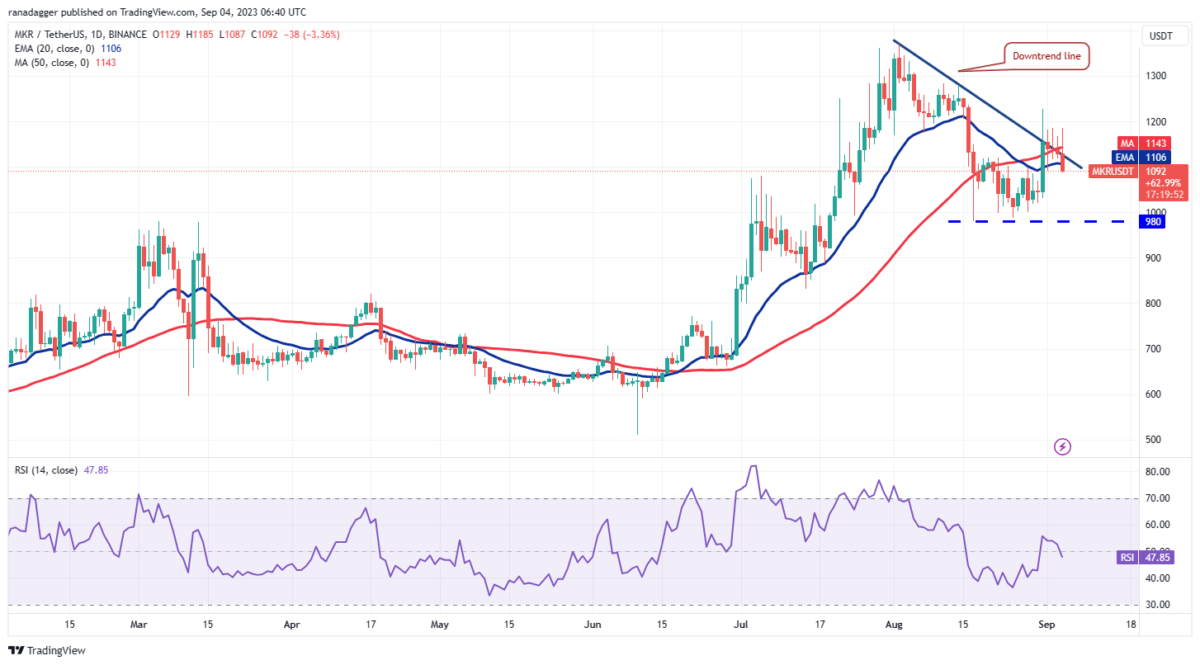
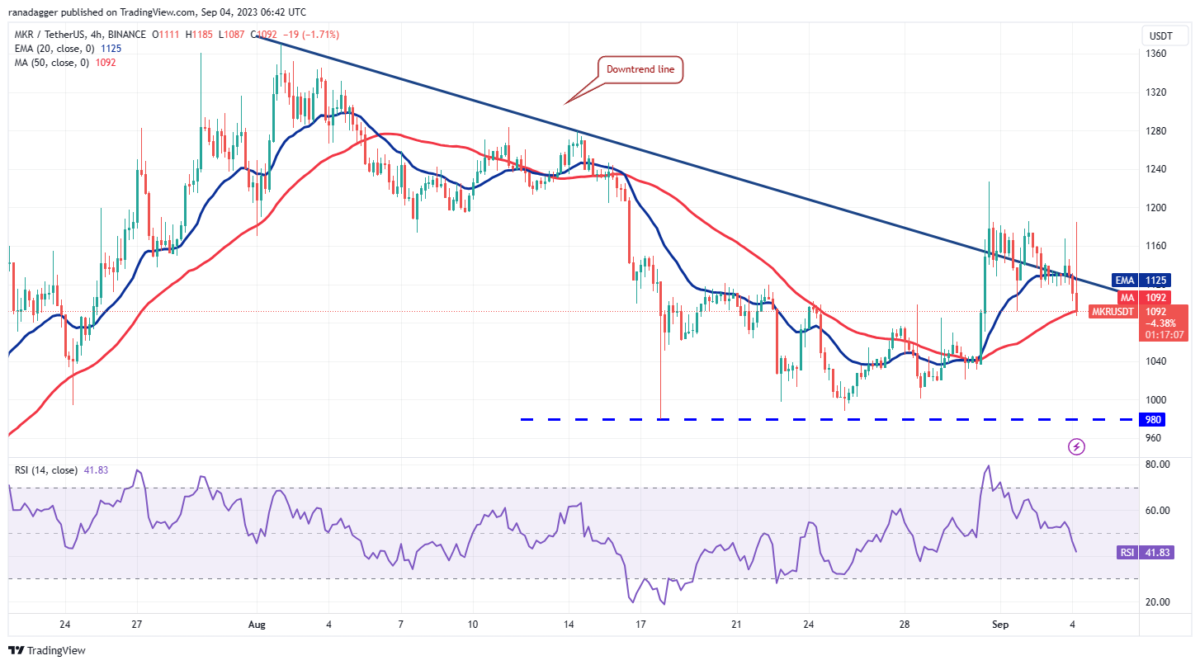
Instead, if the price stays below the 20-day EMA ($1,106), it will indicate that the bears have the upper hand. The pair could later decline to the strong support at $980. The 4-hour chart shows that the bulls pushed the price above the downtrend line but failed to sustain higher. This shows that the bears are not giving up and continue to sell in the rallies. The price has dropped to the 50-SMA, which is an important level to consider. If the price turns up from the current level, the bulls will again try to clear the $1,186 and then the $1,227 barrier. If this zone scales, the rally could reach $1,280.
Tezos price analysis: These levels are critical for altcoin
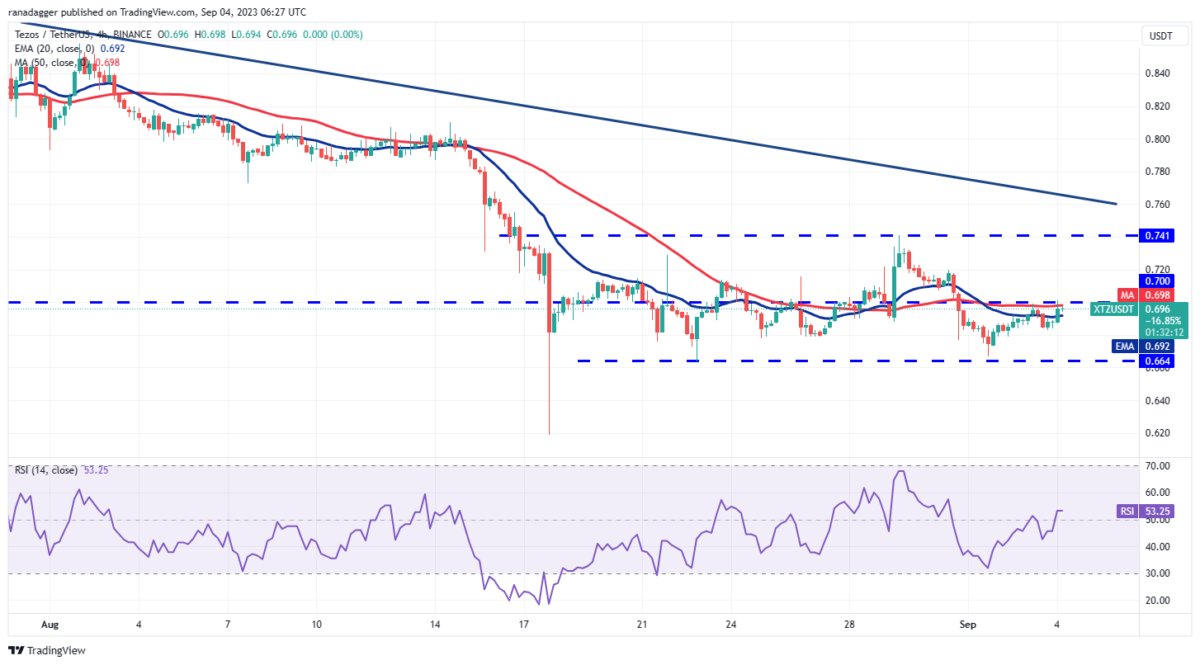
Tezos has witnessed a struggle between bulls and bears near strong support. The inability of the bears to push the price below this level and sustain it indicates that there are purchases at lower levels. The downward sloping moving averages point to an advantage for the bears, but the rising RSI indicates that the bearish momentum is waning. A close above the 20-day EMA ($0.71) would be the first sign of strength. This could pave the way for a rally to the downtrend line. This level is likely to act as a formidable hurdle. However, if the bulls overcome this, the XTZ/USDT pair could start a new upward move.
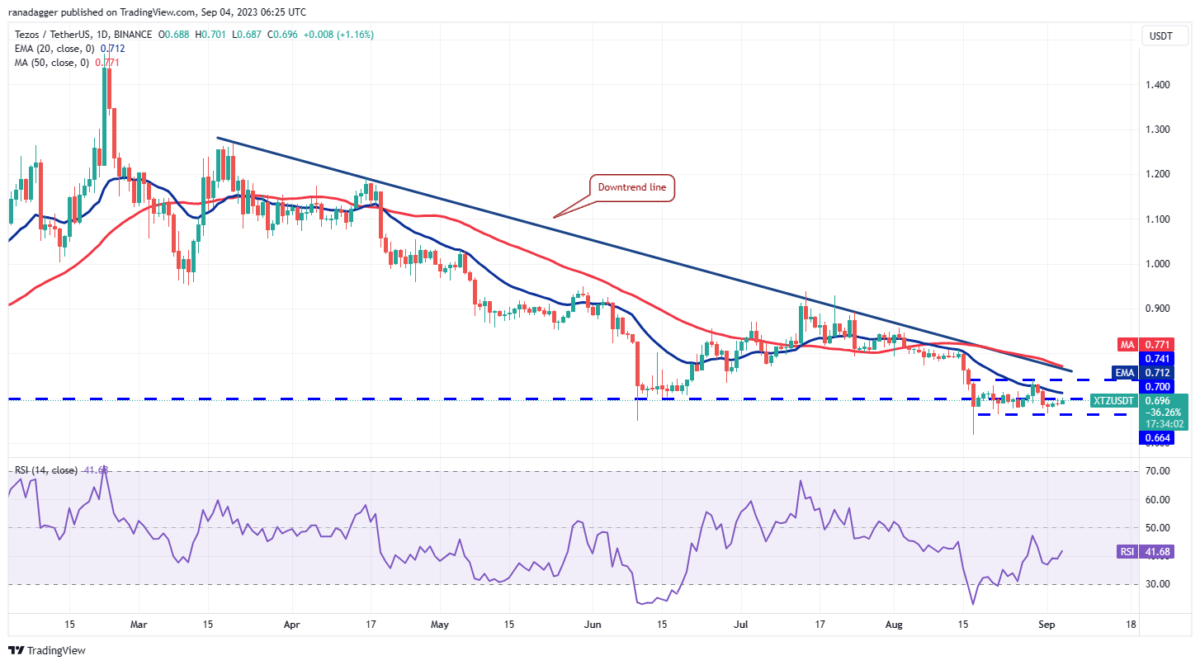
The pair could rally to $0.94 and then to $1.04. This positive view will be invalidated if the price drops below $0.66 and continues. The 4-hour chart shows the price consolidating between $0.70 and $0.66. The crossing moving averages and the RSI near the midpoint suggest a balance between supply and demand. If the price rises above $0.70, the advantage will be in favor of the bulls. The pair could later rally to the overhead resistance of $0.74. The advantage will be in favor of the bears if they drop the price below $0.68. This will likely result in a retest of support at $0.66. If this level collapses, the pair could start the next leg of the downtrend towards $0.61.
