Foretelling the May 2021 market crash, Dave the Wave went after technical indicators that gave a green signal. The analyst says that the bull market for this altcoin has begun.
Weekly Gaussian channel gave green light for this altcoin
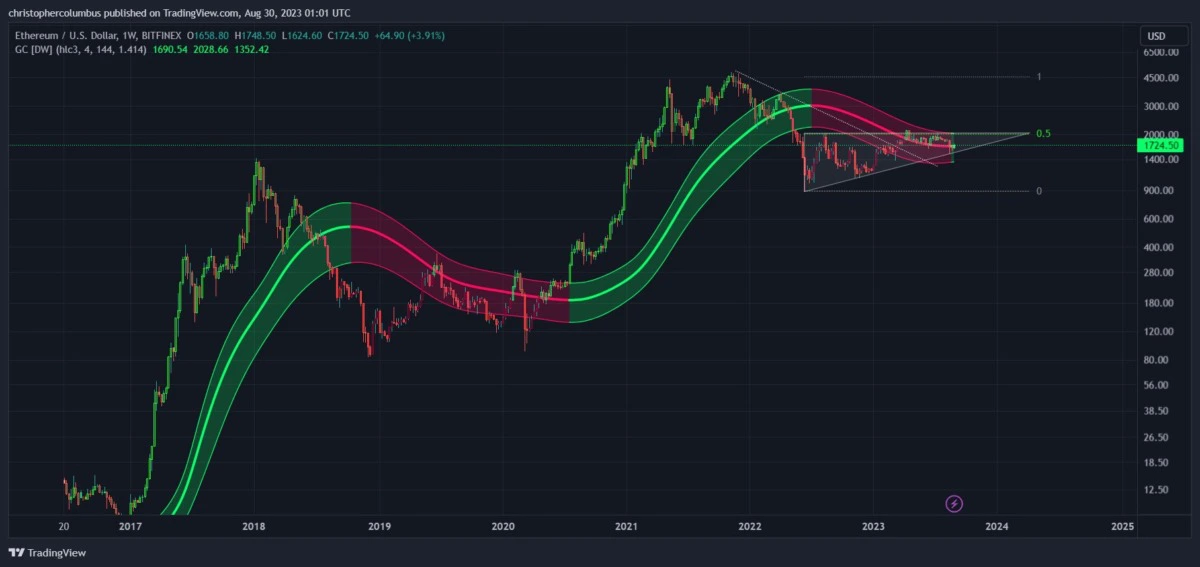
In his current analysis, Dave the Wave reported that a key indicator for Ethereum (ETH) is now trending upwards. The indicator in question takes into account volatility in addition to the moving average (MA) data. The analyst says that the weekly Gaussian channel signals a new bull cycle after ETH price surpassed the 1,700 level.
Gaussian channels are momentum indicators that can be used to identify price reversals. This channel has now reached the starting zone for the bulls, as confirmed by Dave the Wave.

Next, the analyst gave weight to Bitcoin (BTC) using his own version of logarithmic growth curves (LGC). According to the analyst, Bitcoin is giving green signals, as is the case for the leading altcoin.
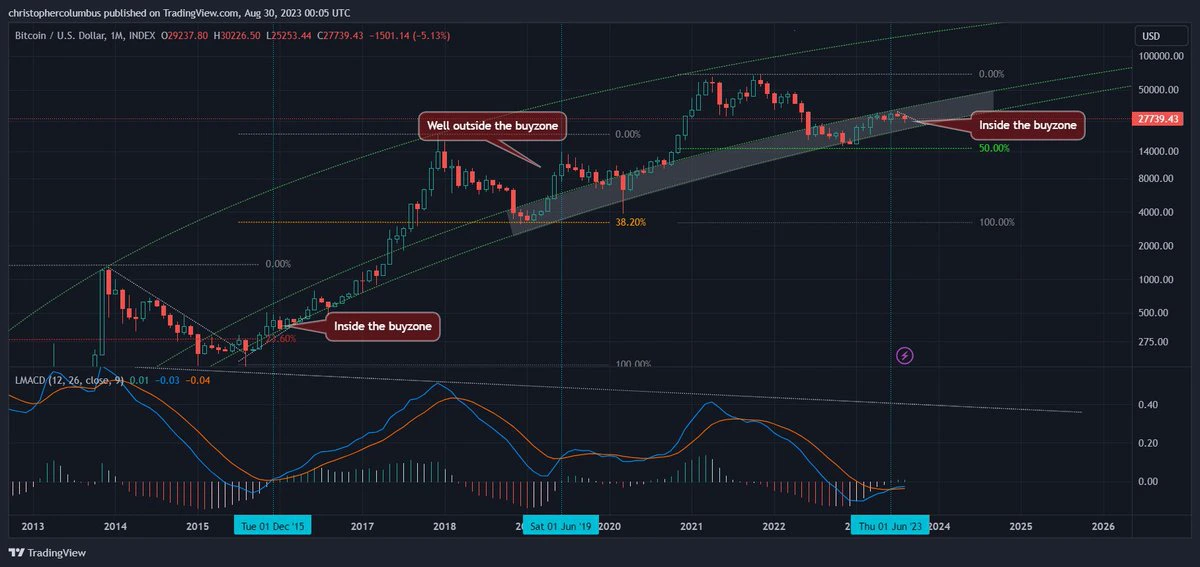
“BTC LGC is in the buy zone”
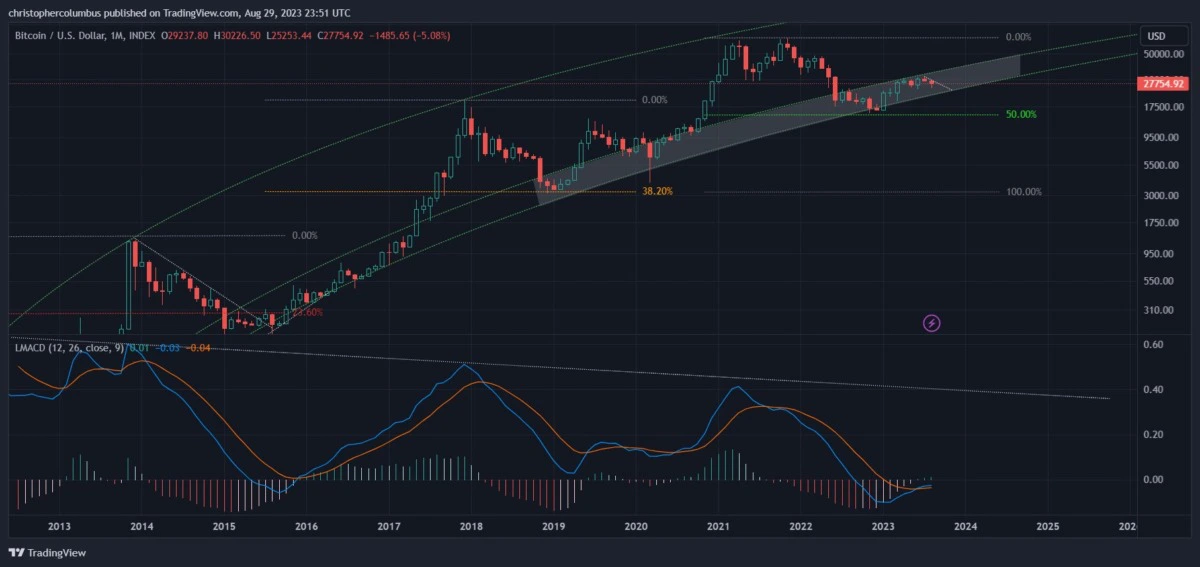
Looking at the chart below shared by the analyst, Bitcoin’s current price in the $27,000 range places BTC approximately halfway between the upper and lower bounds of the LGC range, which he calls the “buy zone.” Dave the Wave explains what this technically means:
Yes, there may be some price consolidation in the short term, but sensible speculation building on the long-term trend and actually creating positions has the price still in the investor’s BTC LGC buying zone.

Its chart shows that the LGC lower bound will rise to $50,000 by 2026. LGC’s lower bound has reliably stood as Bitcoin’s market base, according to the investor. He also says that Bitcoin’s logarithmic moving average divergence (LMACD) indicator similarly tracks BTC’s market base. The LMACD indicator is designed to reveal changes in a crypto’s trend, strength and momentum. According to their analysis:
The monthly MACD [LMACD = logarithmic scale] is a long-term indicator. Combined with the LGC [logarithmic growth curve], it has served BTC investors well.

As reported by Kriptokoin.com, the next big development for the Bitcoin and altcoin market will be the SEC’s decision regarding spot Bitcoin ETF applications. Currently, most analysts are waiting for a positive decision from the regulator. You can take a look at what Bloomberg and CNBC analysts have said lately in this article.