
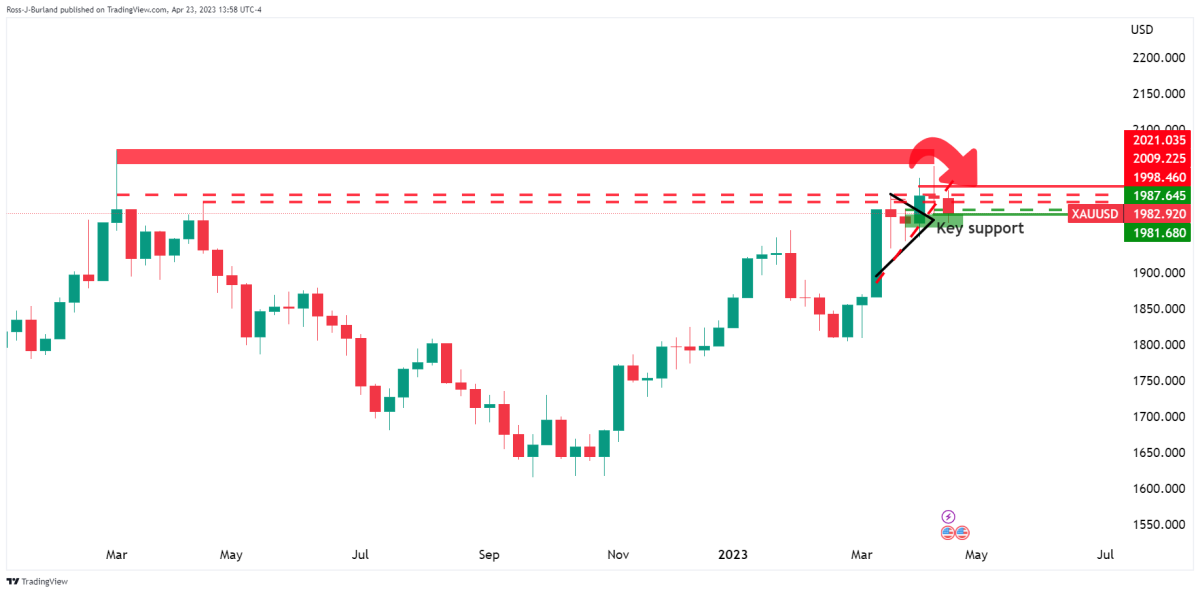
According to technical analyst Ross Burland, the golden bears are rushing to test $1,970. Noting that the gold price is under pressure on the front, the analyst is waiting for a move to test $1,970 ahead of $1,950, according to the weekly chart structure. Meanwhile, analysts expect Bitcoin to reach the $26,600-$25,000 region, where buying interest could increase. Technical analyst Rakesh Upadhyay comments on Bitcoin’s technical outlook.
Gold price technical analysis
According to the pre-opening analysis of the previous week, the gold bulls remain in control. Where the weekly chart saw the W-formation leaning towards the neckline of the gold price, a bullish phase was expected as follows:
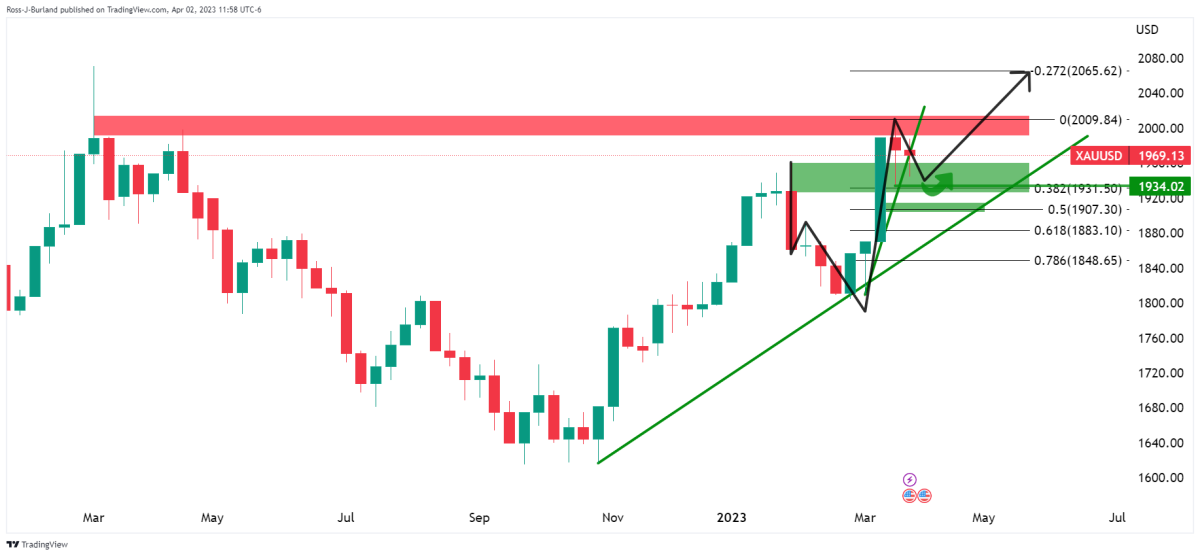
We have a move towards resistance, as continued analysis shows:
As shown above and below, it was then seen that we could have a top pattern for gold price:
 Gold price 4-hour chart (previous analysis)
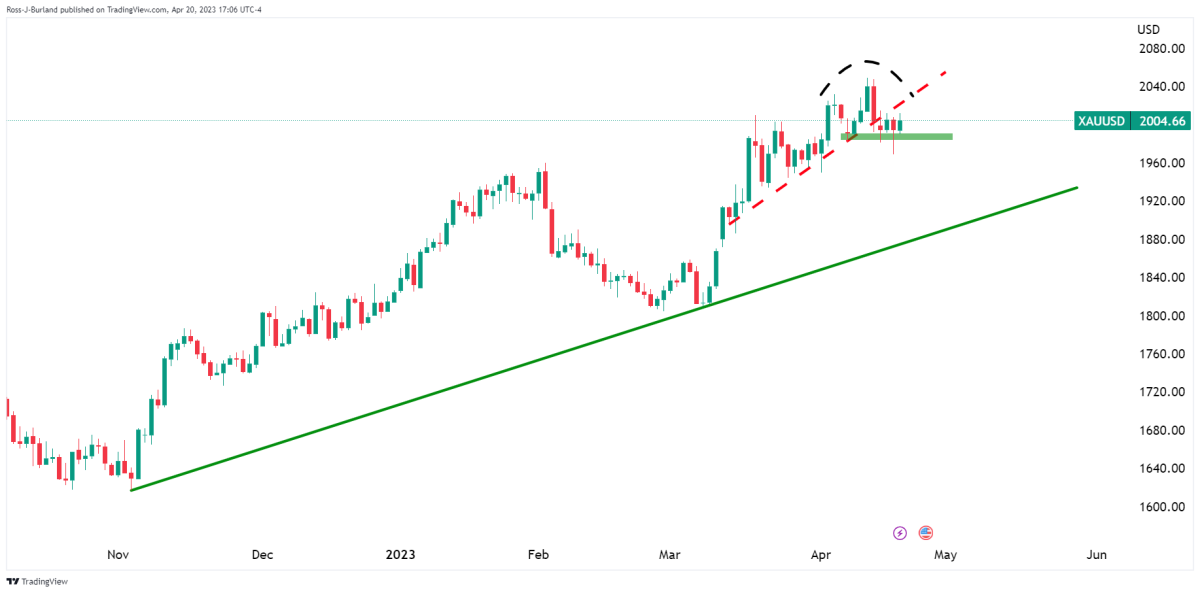
Gold price has slipped behind the trendline support and the neckline horizontal support of the gold price Head and Shoulders pattern needs to be broken to turn the bias from consolidation to downright negative:
Gold, live updates
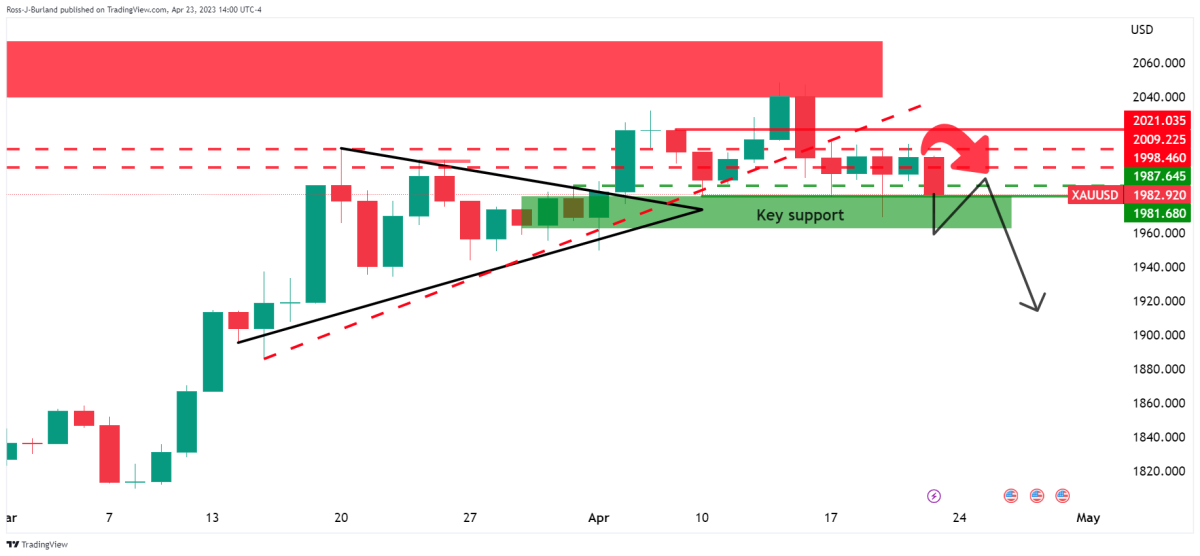 weekly chart
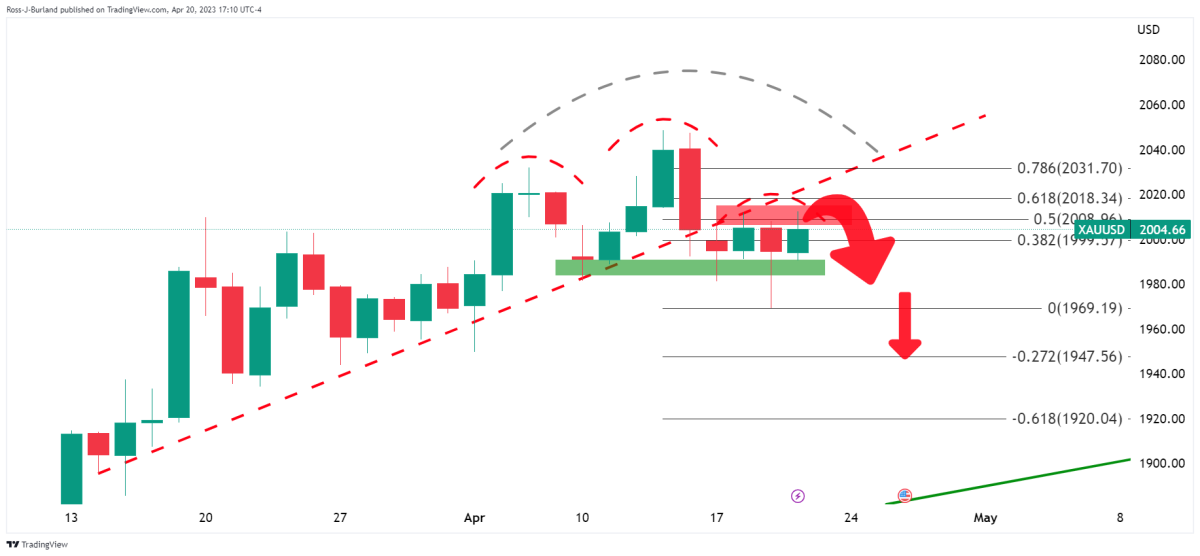
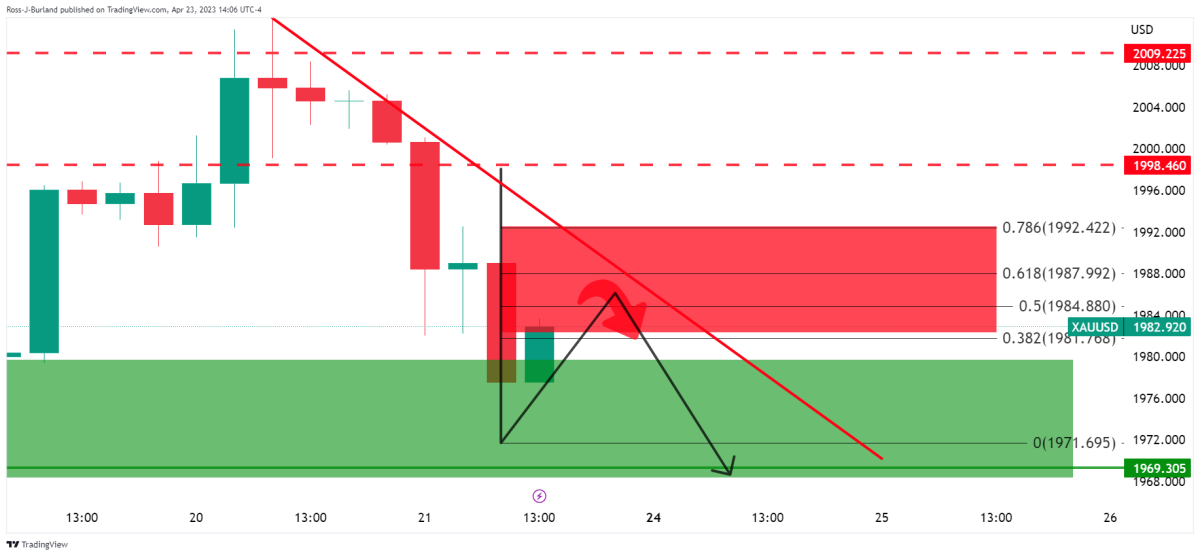 4 hour chart
Currently, gold meets support and the price is correcting. As long as gold price stays on the front side of the downtrend line, the correction will struggle to maintain momentum and $1,970 will be seen as the next key target for the bears.
Gold could drop further and hit $1,962
From a fundamental perspective, TD Securities analysts explained that the continued hawkish speeches by US FOMC members and unexpectedly robust economic data have convinced investors that the US central bank may not be returning to a dovish policy stance anytime soon. Analysts point out the following levels:
As yields rise along the yield curve and the dollar strengthens, many executives have switched to shorts. This turned out to be the right decision as the yellow metal is at the time of this writing some $66 away from the $2,048 level. Considering that the US economic data continues to be strong and the Fed’s interest rate hike in May is considered, prices may fall further and support the $1,962 level. This would be in line with our Q2 estimate of $1,975.
Bitcoin price analysis: Bears are not willing to give up
Buyers are trying to stop Bitcoin’s correction at the 50-day simple moving average (SMA) ($26,983), but the shallow bounce shows that the bears are not willing to give up.
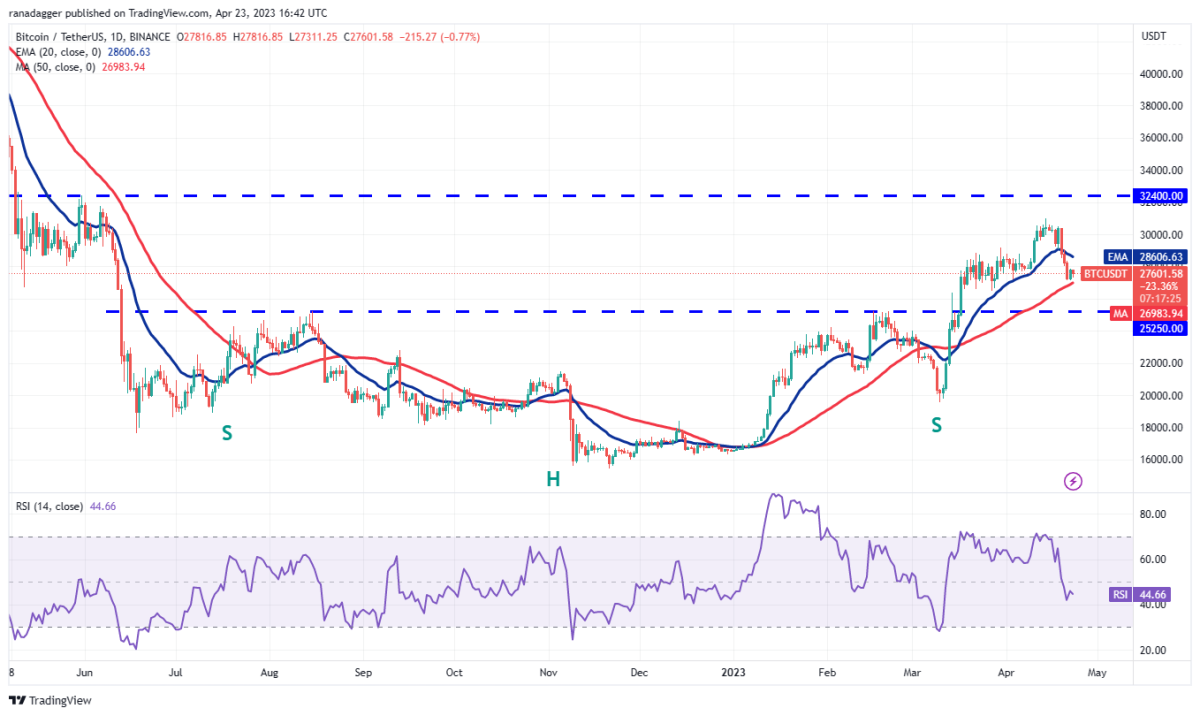 BTC daily chart / Source: TradingView
The 20-day exponential moving average (EMA) ($28,606) has started to turn down and the relative strength index (RSI) is in the negative territory, signaling that the bears have a slight advantage. If the 50-day SMA is broken, the selling could increase even more. BTC could then slide as low as the $25,250 breakout level. This is an important level to consider, because if this support breaks down, BTC could drop to $20,000. Buyers will need to push and sustain the price above the 20-day EMA to signal a reversal. This could attract buying and push the price towards the $31,000-32,500 resistance zone.
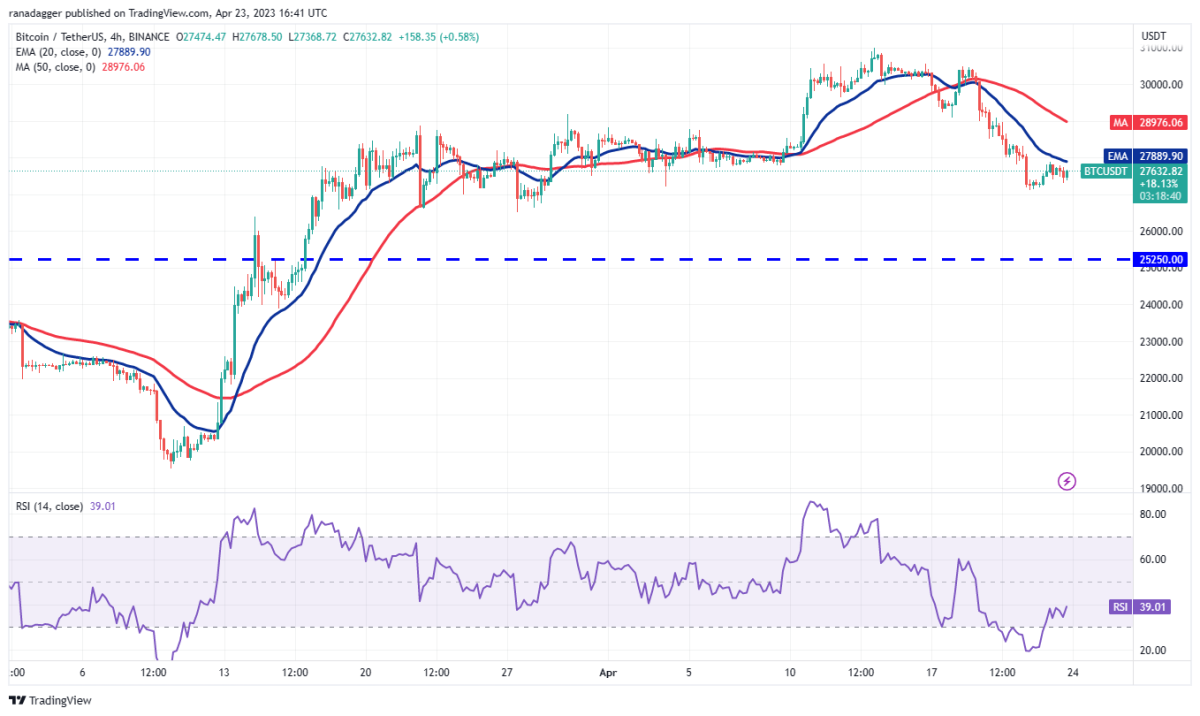 BTC 4-hour chart / Source: TradingView
Bitcoin bounced off $27,125 and reached the 20-day EMA. This is the first hurdle the bulls must cross to start a strong recovery. BTC could then reach the 50-day SMA, where the bears will try to put up a strong defense again. If the price drops from the current level and dips below $27,125, it will indicate that sentiment remains negative and traders are selling on every minor rally. This would increase the possibility of a drop to $26,500 and eventually to $25,250.


 41430
41430


