
Leading crypto Bitcoin (BTC) is trying to protect $16,000 despite the negative market sentiment. However, a Bitcoin metric marks an all-time low. Will the leading crypto fall to 10 thousand dollars?
BTC to Bitcoin rainbow metric, in the lowest band
Leading crypto Bitcoin (BTC) struggled for days not to lose more. During this time, Bitcoin bulls gained some ground, fixing the price below $17,000. Meanwhile, investors are looking for signals that could trigger Bitcoin’s price action in either direction. Bitcoincenter’s rainbow price chart is one of the metrics the market uses to determine the next possible price action. The tool uses color bands that follow a logarithmic regression. It also reviews past performance to provide potential insight into long-term movements.
As of November 19, the Bitcoin rainbow metric has dropped below the ‘Basically a Fire Sale’ level for the first time, represented by the color blue. This level is the lowest band on the Bitcoin rainbow chart. According to the chart, BTC has been stuck in the ‘Basically Fire Selling’ zone for several weeks. Historically, BTC has reached the level in March 2020 when the asset consolidated before finally recovering towards last year’s bull market.
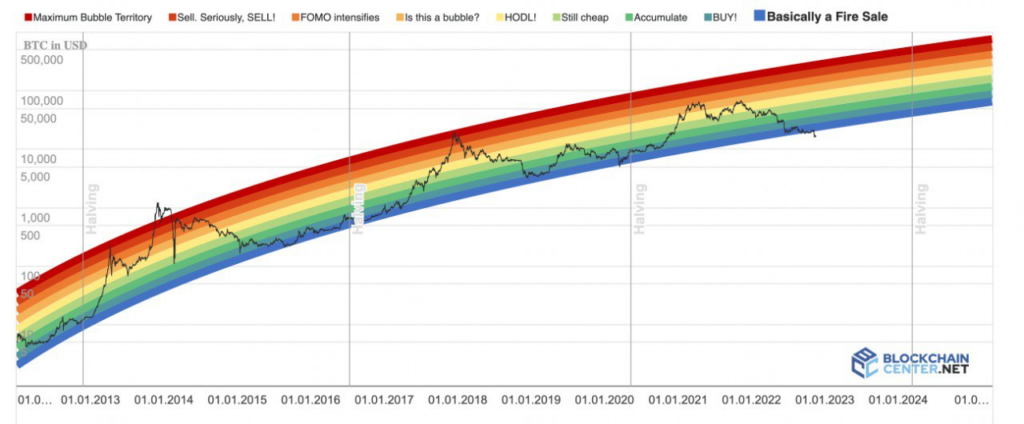 Bitcoin rainbow chart / Source: Blockchaincenter
Interestingly, however, the metric remains bullish for Bitcoin’s long-term prospects. Moreover, he emphasizes that BTC will likely reach a six-digit value in the next two years. At the same time, the chart also points to Bitcoin’s possible HODL status at the end of the year.
Bitcoin downtrend ending?
The bearish breach of the indicator comes after Bitcoin has exhausted its downward momentum, which was triggered in part by the FTX collapse. At the current price, Bitcoin found a support level at $16,200. Also, breakout of the position will likely lead to further corrections, according to analysts.

Indeed, analysts have recently highlighted the possibility of more corrections towards $10,000 after Bitcoin gave its strongest sell signal since 2021. Overall, BTC price remains in a bear trend with failed attempts to surpass $17,000 amid low buying pressure as liquidity concerns persist.
Meanwhile, Bitcoin has found some stability. Now, the earlier focus of the bulls is looking for potential to trigger a rally towards $18,000. In recent weeks, the $18,000 level has emerged as a crucial support position for BTC.
BTC technical analysis
From a technical analysis perspective, Bitcoin daily indicators are leaning in a bearish direction. The summary indicator points to ‘sell’ at 10. The moving averages, on the other hand, suggest a ‘strong sell’ at 14. Also, the oscillators are ‘neutral’ at nine.
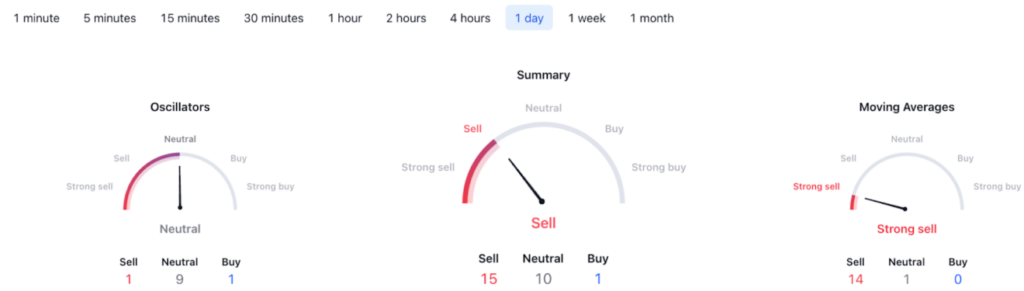 Bitcoin technical analysis / Source: TradingView
Currently, BTC was trading sideways at $16,649 in the last 24 hours. Overall, once the uncertainty from the FTX crash is gone, Bitcoin is likely to make new moves.
By the way, as you can follow on Kriptokoin.com, most trading platforms publish proofs of reserve. However, despite this, on-chain data shows that Bitcoin is migrating from exchanges to self-custody wallets. Currently, one of their focuses is the ability of crypto exchanges to assure users that their funds are safe.


 29888
29888


