Bitcoin metrics and long-term holders’ confidence point to a market bottom formation, according to crypto analyst Yashu Gola. We have prepared the analyst’s metric reviews and evaluations for our readers.
BTC price has been holding above $18,000 since June
Bitcoin (BTC) tumbled after macro indicators that the Fed will continue to raise rates. However, BTC remains in the $18,000 – $20,000 range, showing a strong bias clash in the market.
Notably, BTC has failed to drop below $18,000 since it first tested it in June 2022. As a result, some analysts believe the leading cryptocurrency has bottomed out, given that it has corrected over 70% from the record high of $69,000 it saw almost a year ago.
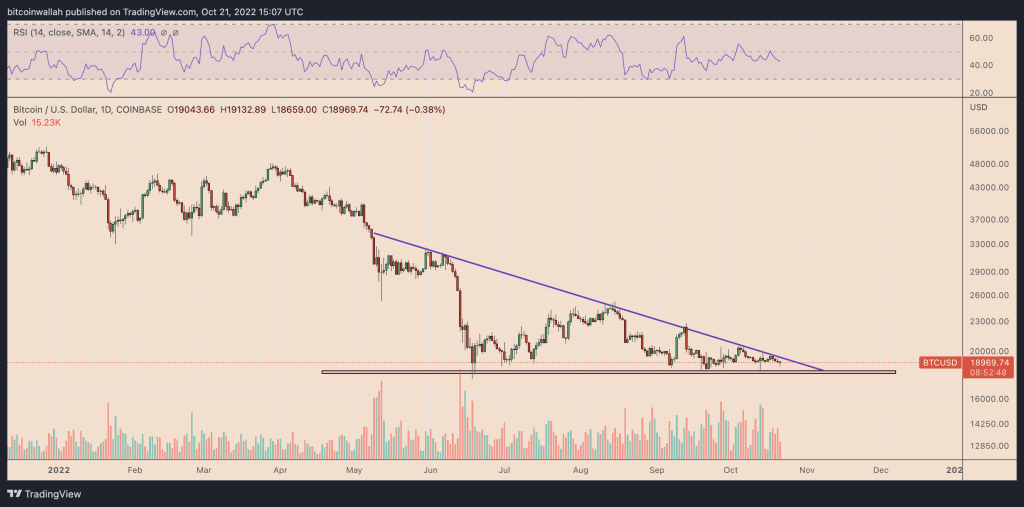 BTC daily price chart / Source: TradingView
In its weekly crypto market report, Arcane Research highlights the following:
During the 2018 bear market, BTC saw a maximum drop of 84% from peak to bottom, which lasted 364 days. The 2014 cycle was longer at 407 days. Both bottoms were followed by unusually low volatility.
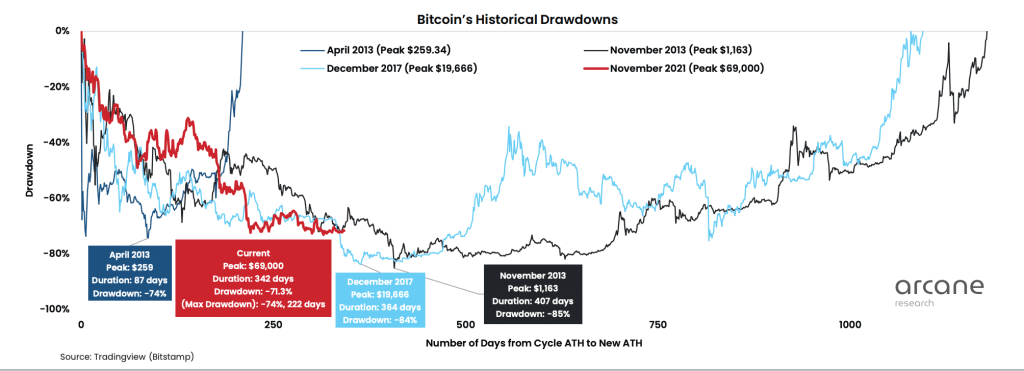 Historical disadvantages of Bitcoin / Source: Arcane Research
In addition, widely watched on-chain Bitcoin metrics also point to a possible bullish reversal in the future. Let’s take a look at some of the most historically important metrics.
Bitcoin MVRV-Z Score
The MVRV-Z Score evaluates Bitcoin’s overbought and oversold conditions based on its market and fair value. Historically, when Bitcoin’s market cap exceeds its fair value, it indicates a market peak (red zone). Conversely, when the market value falls below the fair value, it indicates the market bottom (green zone).
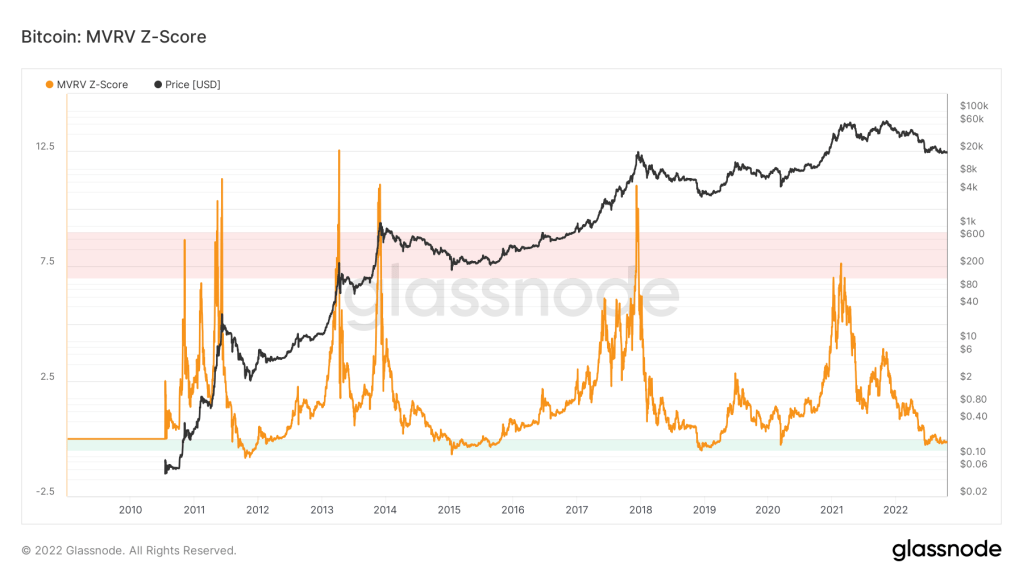 Bitcoin MVRV Z-Score / Source: Glassnode
The MVRV-Z Score has been in the green zone since the end of June. This shows that Bitcoin has hit the bottom.
Reserve Risk
Bitcoin’s Reserve Risk assesses the trust of long-term holders of the token based on its current price. Historically, a higher Reserve Risk (red zone) has coincided with market peaks reflecting lower investment confidence at record high Bitcoin prices. Conversely, higher confidence and lower Bitcoin price mean lower Reserve Risk (green zone) or better risk/reward for investment.
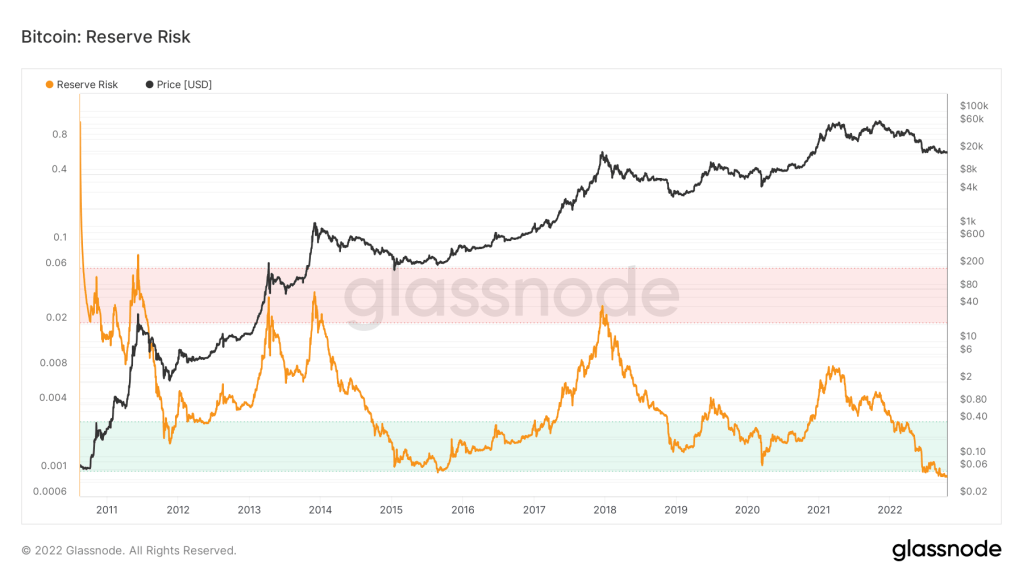 Bitcoin Reserve Risk and Price / Source: Glassnode
Bitcoin’s Reserve Risk plunged into the green zone in late June. Thus, he signaled that sooner or later BTC will experience a strong bullish reversal.
Bitcoin Puell Multiple
Puell Multiple reflects the rate of daily Bitcoin issuance and the moving average of 365 days of issue value. Historical data shows that the Bitcoin market bottomed out when the Puell Multiple fell into the green zone defined in the range of 0.3-0.5. Conversely, the market peaks when the rate moves into the 4-8 red zone.
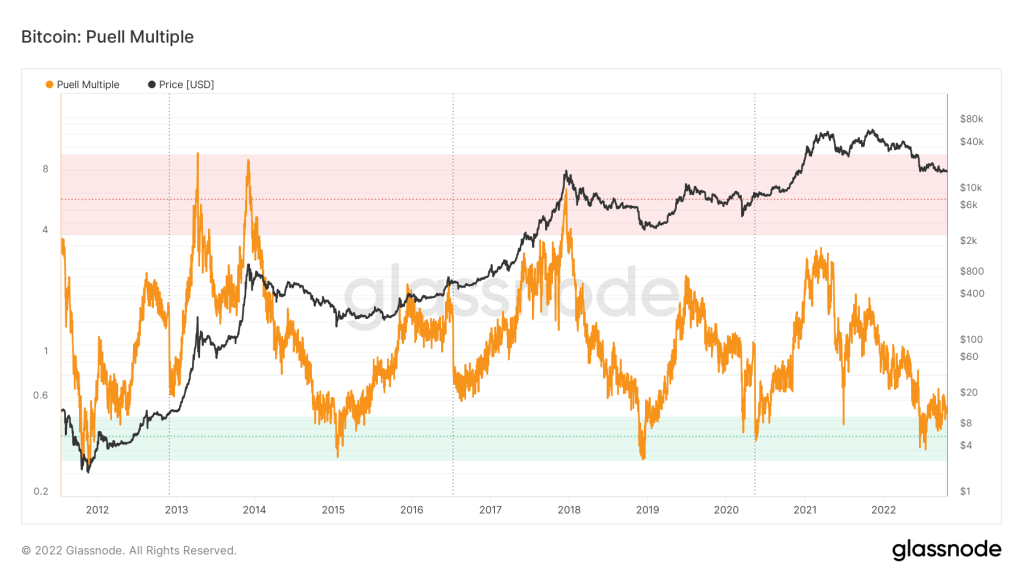 Bitcoin Puell Multiple vs. price/Source: Glassnode
As of October, Bitcoin’s Puell Multiple is inside the green zone. This indicates a potential price reversal to the upside. As Cryptokoin.com reported, the BTC balance on cryptocurrency exchanges has also dropped to several-year lows, the fastest since June. This indicates that current price levels have become an important accumulation area.