Altcoins including Bitcoin and SHIB sold out sharply on August 19. It has led technical traders to predict a possible drop to new year lows. Can Bitcoin and most altcoins challenge June lows, or will the bulls buy the current dip? Crypto analyst Rakesh Upadhyay examines the charts of the top 10 cryptocurrencies to find out.
An overview of the cryptocurrency market
As you follow on Kriptokoin.com, Bitcoin (BTC) and most major altcoins witnessed a sharp sell-off on August 19. But there doesn’t seem to be a specific trigger for the sudden drop. The sharp decline has resulted in more than $551 million in liquidations in the last 24 hours, according to data from Coinglass.
Except for a V-shaped bottom, other formations often take time to complete as buyers and sellers try to gain the upper hand. This tends to cause a few random variable moves, which can be an opportunity for short-term traders. But long-term investors should avoid making noise.
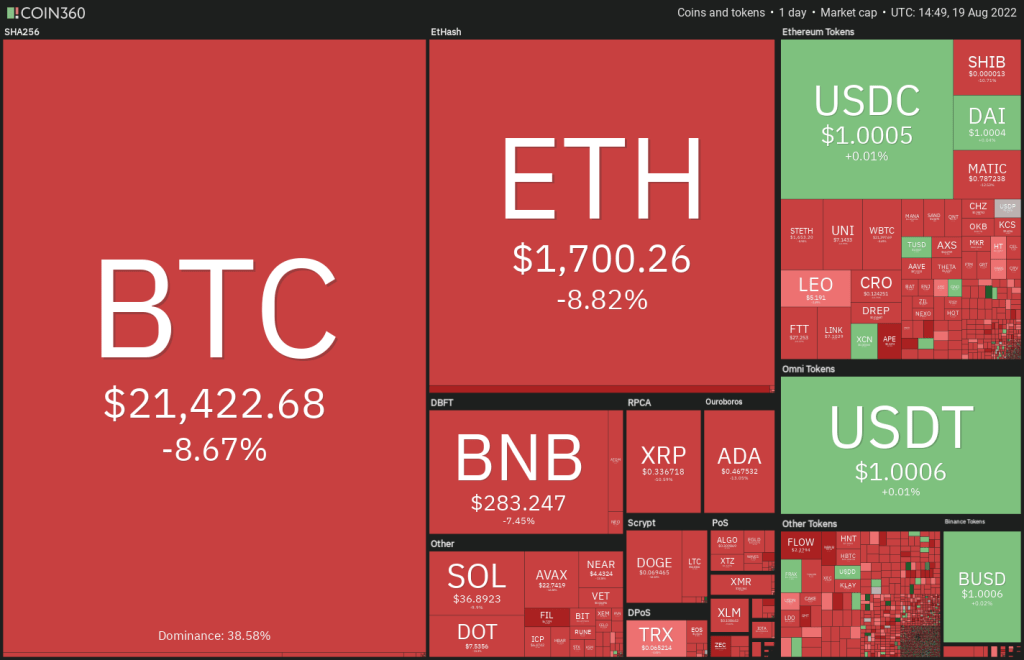 Daily cryptocurrency market performance / Source: Coin360
Glassnode data shows that investors who bought Bitcoin in 2017 or earlier did so simply by holding their positions. The percentage of Bitcoin supply that has been idle for at least five years reached an all-time high of 24,351% on August 18. This shows that holders are not in a panic or willing to sell for small gains. Now it’s time for analysis…
BTC, ETH, BNB, XRP and ADA analysis
Bitcoin (BTC)
Bitcoin’s main trend is bearish but the bulls are trying to make a bottom. The price has been rising inside an ascending channel for the past few days. The failure of the bulls to push the price above the resistance line of the channel may have encouraged short-term traders to take profits. This pulled the price below the moving averages.
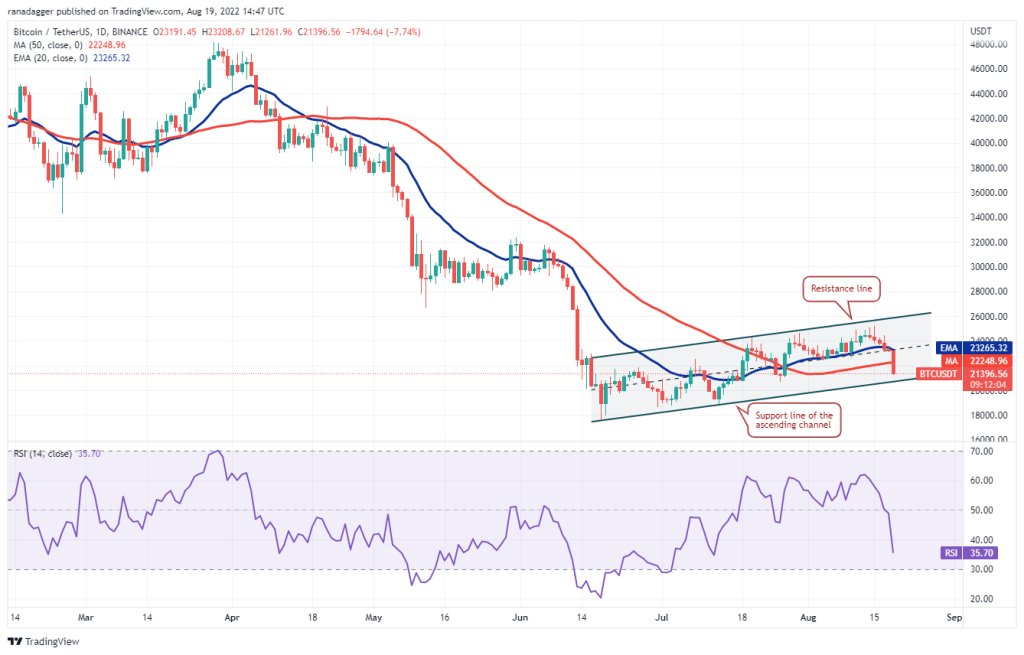
When BTC drops to the support line of the channel and the price is trading inside an ascending channel, traders usually try to buy the dips at the support line and sell near the resistance line. Therefore, it is likely to bounce off the support line. If this happens, buyers will try to push BTC above the moving averages. A break and close above the 20-day exponential moving average (EMA) ($23,265) is possible to open the doors for a possible rally to the resistance line. This positive view is likely to be invalidated if the price breaks and stays below the channel. Such a move is likely to open the doors for a possible drop to $18,626.
Ethereum (ETH)
ETH broke below the 20-day EMA ($1,771) on August 19. This is the first sign that the recovery is losing momentum. The key level to watch on the downside is $1,700 as it acts as a strong support between August 6 and 10.
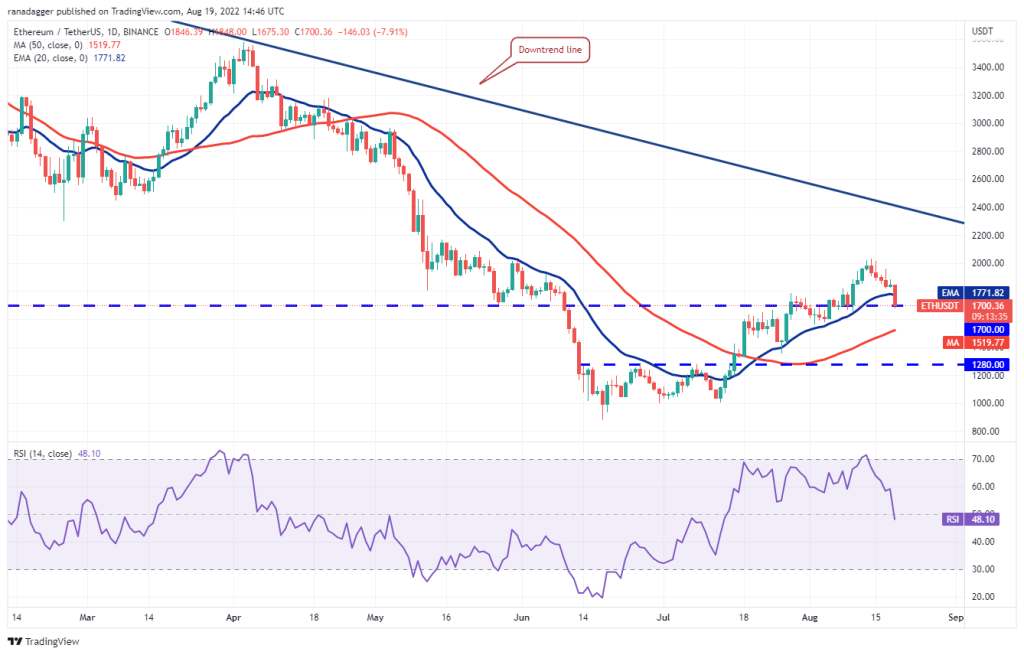
If the price returns with strength to $1,700, it will indicate that the bulls are attempting to turn this level into support. ETH is likely to rally to $1,960 and then $2,030 later. A break above this level is possible, indicating a resumption of the uptrend. ETH is likely to rise to the downtrend line later on. Contrary to this assumption, if the price breaks and stays below $1,700, it indicates that traders who may have bought lower are aggressively closing their positions. It is possible that this will push ETH to the 50-day simple moving average (SMA) ($1,519).
Binance Coin (BNB)
BNB broke below the 20-day EMA ($304) on August 17. This shows that short-term investors can make profits. The decline continued further and the price dropped to the 50-day SMA ($272) on August 19. This is an important level for the bulls to defend if they want to keep the recovery intact.
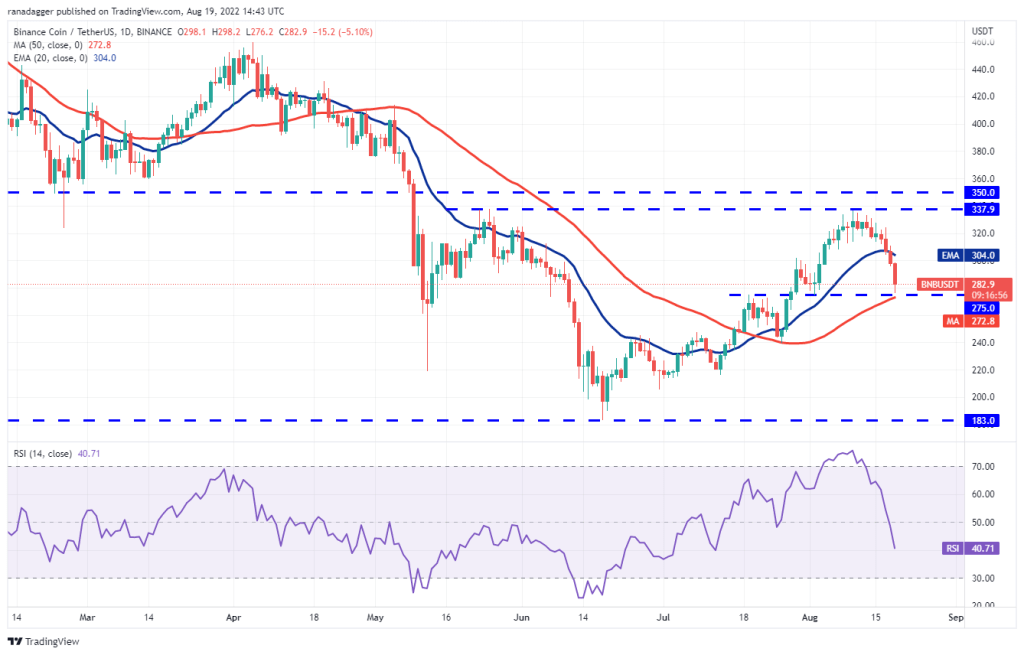
If the price rises from the current level and rises above the 20-day EMA, it is possible for BNB to rally towards the overhead resistance at $338. This is likely to create an inverted head and shoulders pattern that will complete on a break and close above $338. Conversely, if the price drops below the 50-day SMA, BNB is likely to drop to $240. Such a move would suggest that BNB will be stuck in a wide range between $183 and $338 for a while.
Ripple (XRP)
The bulls failed to push Ripple above the overhead resistance at $0.39 on August 17. This shows that the bears continue to defend the level vigorously.
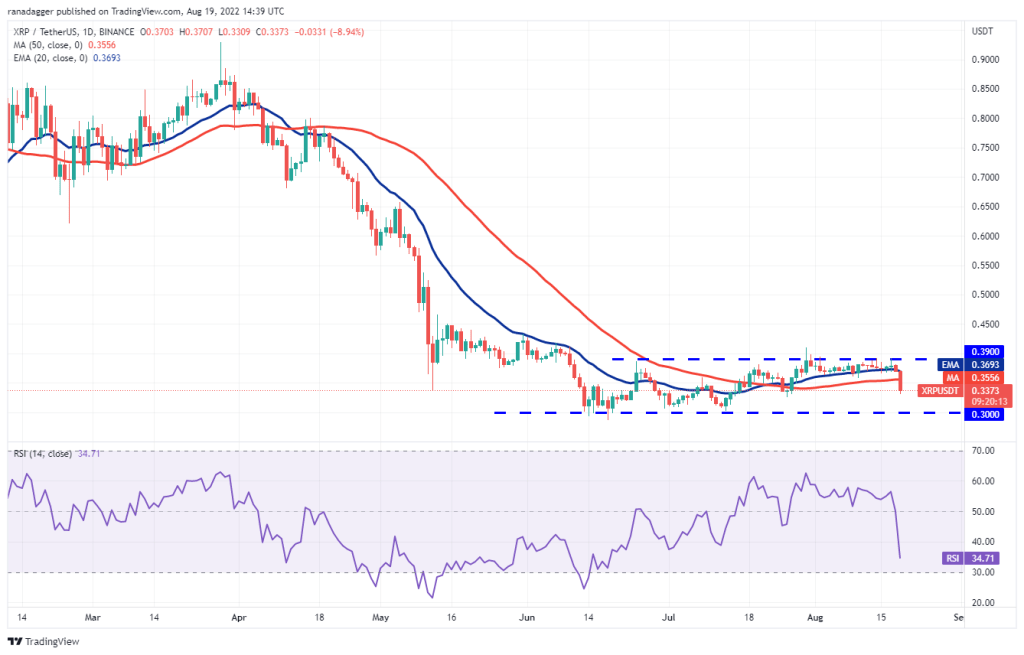
Usually, in a range, traders buy near the support and sell near the resistance. That’s what happens with XRP. The bulls are likely to wait for the price to drop to the support at $0.30 before buying now. If the price bounces back from $0.30, it indicates that range-bound trading could continue for a few more days. The next directional move is likely to start after buyers push the price above $0.39 or bears sink XRP below $0.30. Price action within a range is often random and volatile. For this reason, experienced traders often wait for the breakout to occur before entering a position.
Cardano (ADA)
ADA broke below the 20-day EMA ($0.52) on August 18. It showed that the bulls might be in a rush to close their positions. This gave the bears a slight advantage.
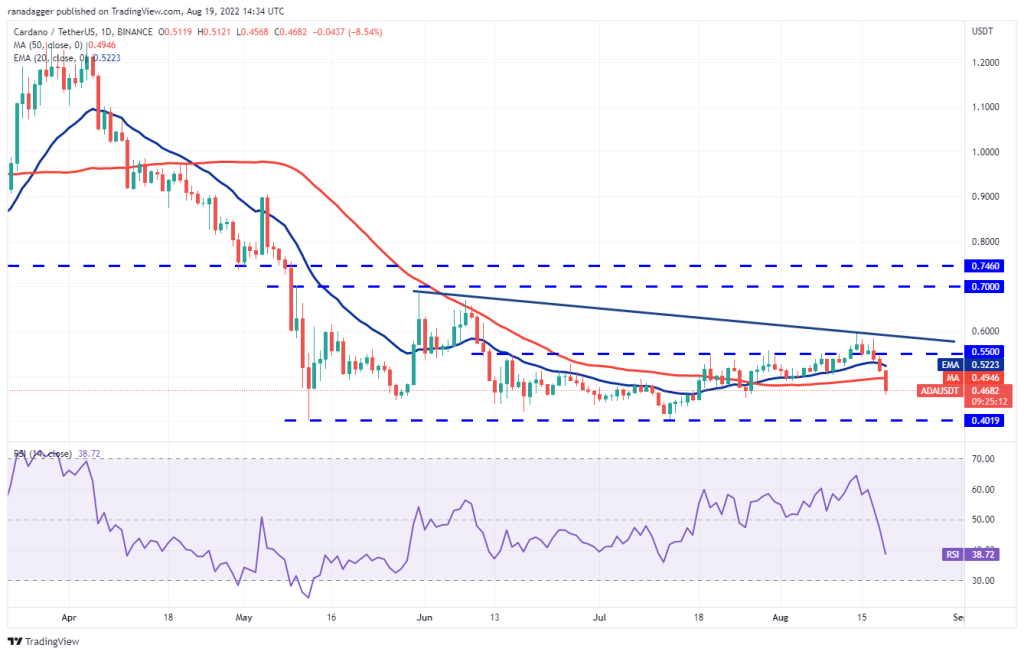
Sellers took advantage of August 19 to push the price below the 50-day SMA ($0.49). This increases the probability of ADA falling to the critical support at $0.40. The bulls have held this level twice before. The odds are therefore in favor of a jump. If that happens, ADA is likely to oscillate between $0.40 and $0.60 for a while. The bears will need to break ADA below $0.40 to start the next leg of the downtrend.
SOL, DOGE, DOT, SHIB and AVAX analysis
Left (LEFT)
SOL bounced off the support line on August 18. The bulls tried to push the price above the 20-day EMA ($41). But the bears successfully defended the level.
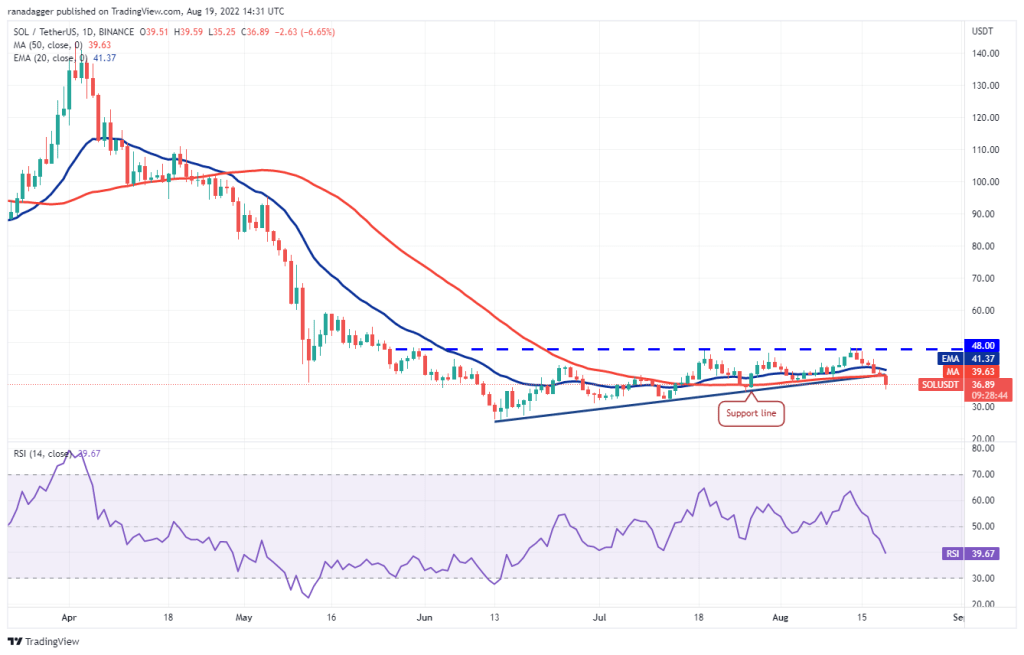
This made the sale on August 19 worse. Later, it dragged the price below the 50-day SMA ($39). This invalidated the ascending triangle pattern. The bears will now try to lower the SOL to $34.50. If the price returns to $34.50, the SOL is likely to attempt a rally above the moving averages. If that happens, it’s possible for SOL to consolidate between $34.50 and $48 for a while. Conversely, a break below $34.50 is likely to take the SOL down to $31.
Dogecoin (DOGE)
DOGE bounced back and broke below the $0.08 breakout level on August 18. This was the first indication that the break above $0.08 on August 14 could be a dead cat bounce.
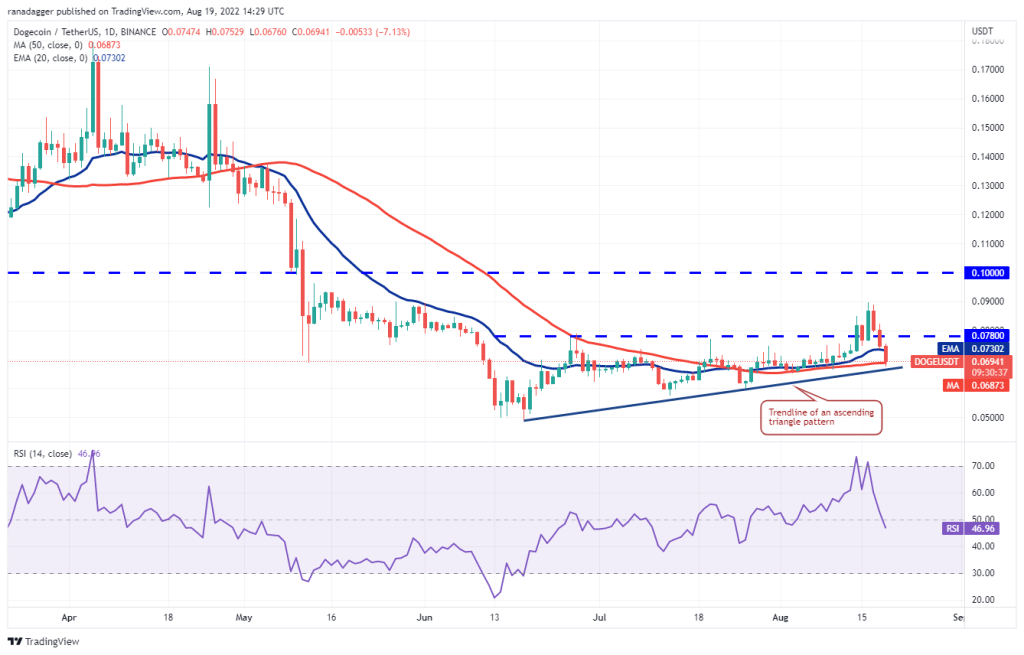
The bears continued their sales. Thus, it pulled the price to the trendline of the ascending triangle pattern. A break below this level is likely to invalidate the bullish setup. It is possible that it could open the doors for a possible drop to $0.06 later. This level is likely to attract strong buying from the bulls. Alternatively, if the price bounces back from the current level, it will indicate that the bulls are trying to defend the trendline. Buyers will have to push DOGE above $0.09 to gain the upper hand.
Polkadot (DOT)
The DOT closed below the 20-day EMA ($8.46) on August 17. This was the first indication that a break above $9 could be a sucker rally. Sellers took advantage of the situation and pushed the price below the 50-day SMA ($7.75) on August 19.
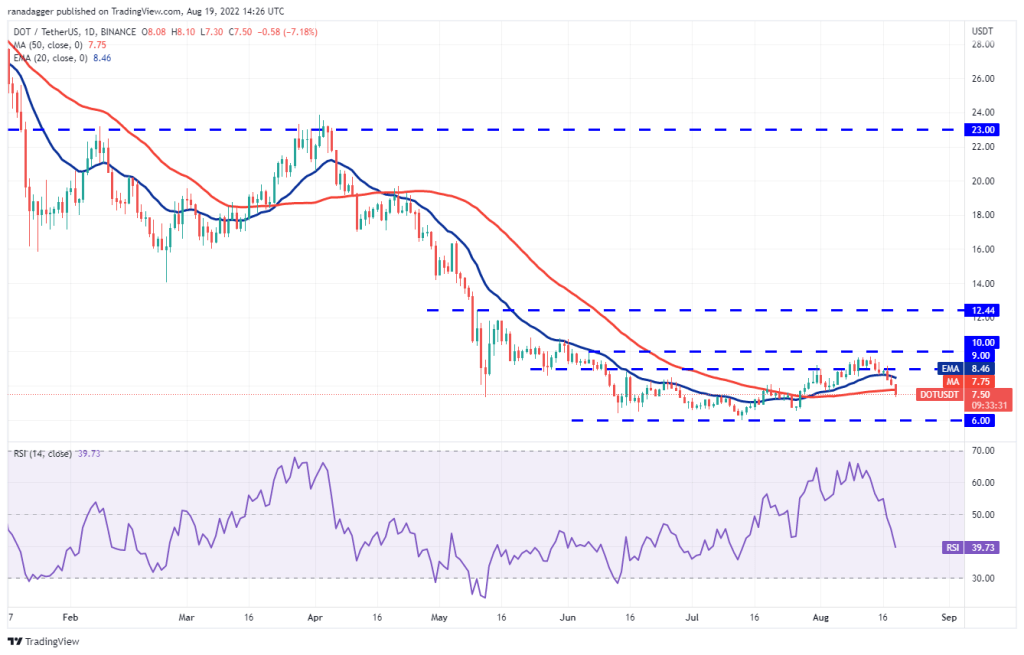
This opens the doors for a possible drop to the key support at $6. This level served as a strong support in the previous two situations. Therefore, the bulls will again try to defend the level with all their strength. If the price returns to $6, the DOT is likely to continue trading in a wide range for a few days. The next strong move is likely to start after the bulls push the price above $10 or the bears push the DOT below $6.
Shiba Inu (SHIB)
In a downtrend, strong rallies often turn into bull traps. This is what happens with the Shiba Inu (SHIB). Buyers failed to sustain SHIB price above $0.000017 on August 17 and built on the momentum. This is likely to have resulted in short-term traders booking profits.
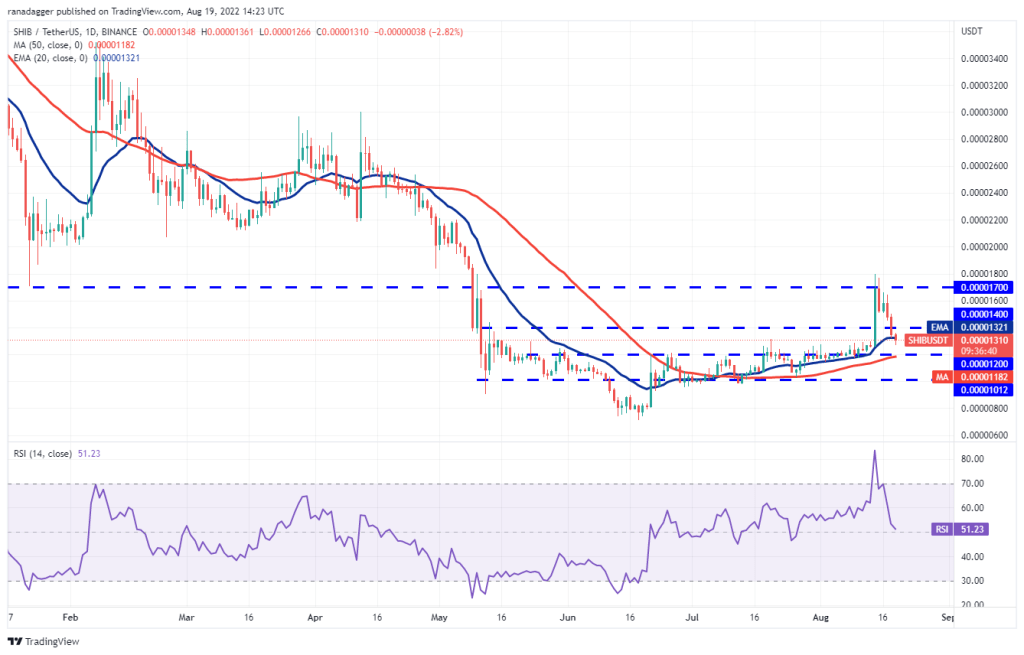
SHIB bulls tried to continue the upward move on August 16. However, the bears held their ground. This aggravated the selling pressure and the bears pushed the SHIB price below $0.000014 on August 18. The bears will try to consolidate their position by pulling the SHIB price below the 50-day SMA ($0.0000012). To invalidate this bearish view, the bulls will need to push the SHIB price above $0.000014. If they do, it will suggest strong buying at lower levels. It is possible that it could clear the way for a possible rally to $0.000017 later. SHIB is likely to signal a trend change above $0.000018.
Avalanche (AVAX)
AVAX failed to stay above the $26.38 break on August 17. This shows that traders are rushing to exit. Selling continued and the price dropped below the 50-day SMA ($22.93) on August 19.
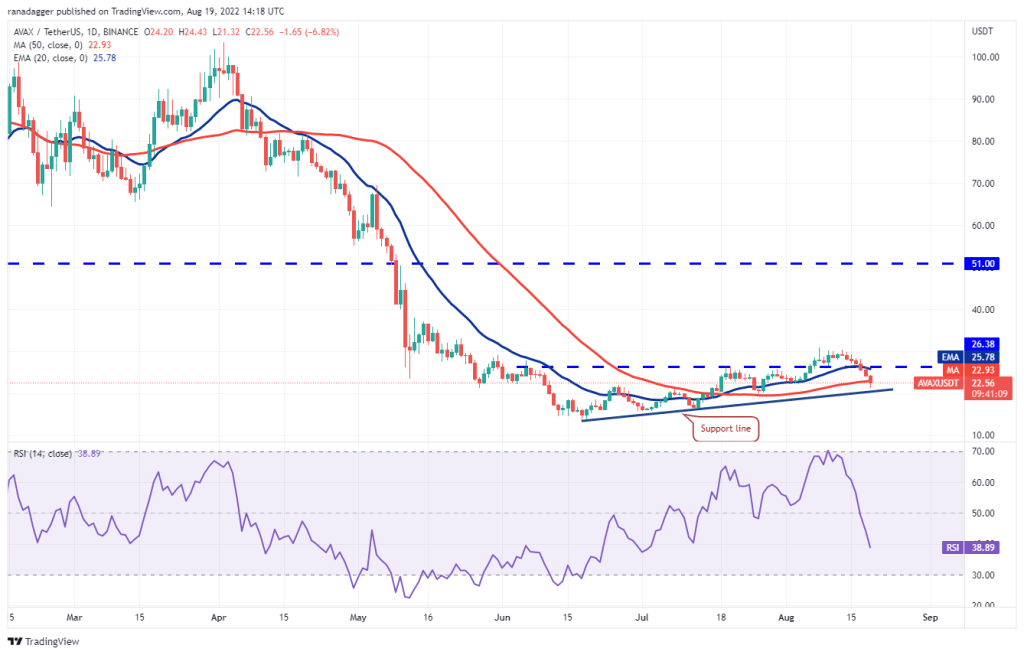
The bulls have to protect the support line. Otherwise, it is possible that the sell-off will intensify and AVAX drops to $16 and then to $13.71. A break and close below $13.71 is likely to mark the start of the next leg of the downtrend. Conversely, if the price breaks out of the support line, it will indicate that the bulls are attempting to form a higher bottom. Buyers will have to push and sustain the price above $26.38 to gain the upper hand. Such a move would increase the probability of a break above $31.