According to crypto analyst Yashu Gola, Bitcoin’s price chart has a target of $28,000 based on the classic bull technical pattern. Bitcoin is down 70% from its November 2021 peak of $69k. However, the analyst notes that BTC’s recovery movement in the last three weeks increases the possibility of further uptrend in the 3rd quarter. We have prepared Yashu Gola’s analysis and predictions for our readers.
Bitcoin looks at 30% price rally
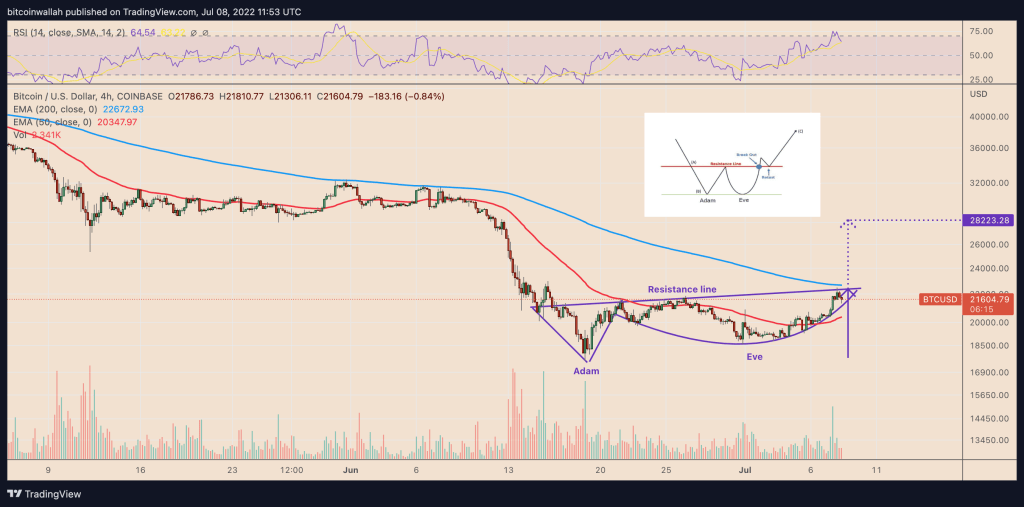
At the center of the Ascension argument is a technical pattern called the ‘Adam-and-Eve double-dip’. In particular, the structure occurs when the price forms two bottoms and recovery cycles. The first loop, called ‘Adam’, has a pointed base, while the other, called ‘Eve’, is round in shape. Also, the peaks of both cycles form a common resistance line.
The Adam-and-Eve pattern dissolves with an increase in trading volume after the price breaks above the resistance line. As a rule of thumb of technical analysis, the target of the breakout typically comes to a length equal to the maximum distance between the lowest point of the pattern and the resistance line.
 BTC four-hour price chart with Adam-and-Eve pattern / Source: TradingView
Considering the technical clarifications, BTC is approaching the Adam-and-Eve pattern break. Suppose the price closes above the resistance line of the structure. Then, it will be more likely to continue its rally to $28,000-28,500. This represents a rally of over 30% in the third quarter of 2022 when measured at the current price level.
Conflicting price signal targets $16,000
However, there is a different situation on larger timeframes. The Adam-and-Eve bull structure seems to contradict another technical setup that is suggesting more pain for Bitcoin in the coming days.
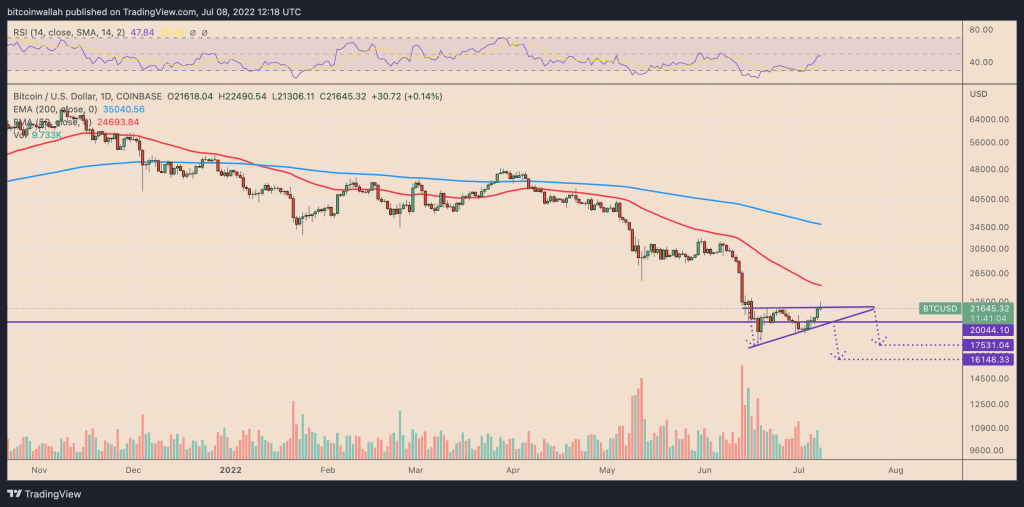
The continuation pattern, called the ‘ascending triangle’, is formed after a sharp move up or down when the price converges within a horizontal trendline resistance and an ascending trendline support. Interestingly, it seems to take shape on the daily candlestick chart after Bitcoin’s bear trend. As the chart below shows, the price may be more bearish as it meets the overhead resistance.
 BTC daily price chart with ascending triangle pattern / Source: TradingView
The bearish scenario of the ascending triangle reveals the $16,000 – $20,000 range depending on the breakout point.
As you follow on Kriptokoin.com, Bitcoin has started a recovery movement in recent days. At press time, BTC was trading at $21,829, up 0.83% on a daily basis, according to data from CoinMarketCap. However, the weekly performance of the leading crypto is not bad for winter conditions with 12.81%. However, considering the $69K peak, Bitcoin has a long way to go.